Is the Recovery In GBP/JPY Over?
JFD Team | Jun 24, 2021 07:46AM ET
GBP/JPY fell sharply on Thursday, after the BoE kept its policy unchanged, with only one member voting in favor of QE tapering. That member was Chief Economist Andy Haldane, for whom this was the last meeting.
The Bank repeated that the surge in inflation is expected to be transitory, and added that they do not want to undermine the recovery by premature tightening, disappointing those expecting signals that something like that could be announced at the next gathering.
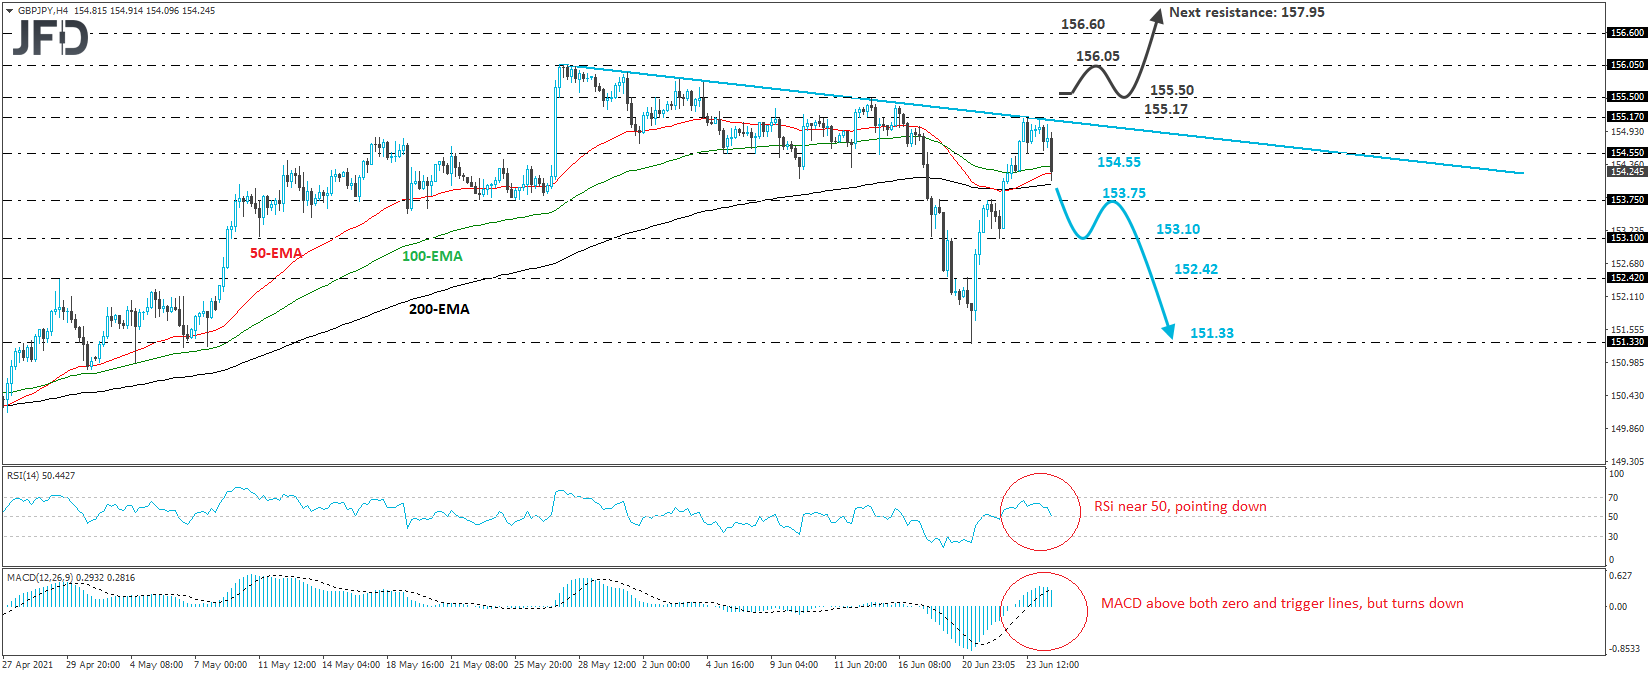
From a technical standpoint, GBP/JPY was trading in a consolidative manner near the downside line drawn from the high of May 27 ahead of the decision, but fell below 154.55, an intraday swing low formed yesterday, immediately thereafter. In our view, this is an early signal that the latest recovery of the pair may be over and that the bears are willing to push the action lower.
We believe that the first support to consider on the bears’ way south may be Monday’s inside swing high, at 153.75, the break of which could allow a test near the 153.10 barrier, marked by Tuesday’s low. If that hurdle is broken as well, then we could see the fall extending towards the 152.42 area, or Monday’s low, at around 151.33.
Taking a look at our short-term oscillators, we see that the RSI has turned down after hitting resistance slightly below 70. Now it is fractionally above 50, but continues to point south and appears ready to fall below that equilibrium line.
The MACD, although above both its zero and trigger lines, has turned down as well. Both indicators suggest that GBP/JPY has run out of upside momentum, enhancing the case that the latest recovery may already be over.
Now, in order to start examining whether the bulls are back into the action and have taken full control, we would like to see a decisive break above 155.50, a resistance defined by the high of June 15.
The rate would already be above the downside line taken from the high of May 27, and thus, the bulls may feel confident to push the action towards that high, at around 156.05. If they are strong enough to overcome that obstacle as well, then we may see them aiming for the high of Feb. 2, 2018, at around 156.60.
In order to identify the next potential resistance zone, we need to go back to 2016 and the day after the Brexit referendum. We will consider as the next resistance the high of that day, which is at around 157.95.
![]()
Trading in financial instruments and/or cryptocurrencies involves high risks including the risk of losing some, or all, of your investment amount, and may not be suitable for all investors. Prices of cryptocurrencies are extremely volatile and may be affected by external factors such as financial, regulatory or political events. Trading on margin increases the financial risks.
Before deciding to trade in financial instrument or cryptocurrencies you should be fully informed of the risks and costs associated with trading the financial markets, carefully consider your investment objectives, level of experience, and risk appetite, and seek professional advice where needed.
Fusion Media would like to remind you that the data contained in this website is not necessarily real-time nor accurate. The data and prices on the website are not necessarily provided by any market or exchange, but may be provided by market makers, and so prices may not be accurate and may differ from the actual price at any given market, meaning prices are indicative and not appropriate for trading purposes. Fusion Media and any provider of the data contained in this website will not accept liability for any loss or damage as a result of your trading, or your reliance on the information contained within this website.
It is prohibited to use, store, reproduce, display, modify, transmit or distribute the data contained in this website without the explicit prior written permission of Fusion Media and/or the data provider. All intellectual property rights are reserved by the providers and/or the exchange providing the data contained in this website.
Fusion Media may be compensated by the advertisers that appear on the website, based on your interaction with the advertisements or advertisers.