Is Platinum Flashing a Sell Signal for Silver and Gold? A Look Back at 2020
Sunshine Profits | Jun 09, 2025 04:33PM ET
Platinum is soaring and palladium jumped higher, too. Both serve as important signals, especially the former.
Platina – means tiny silver in Spanish and the name has an interesting origin. When Spanish conquistadors first encountered this mysterious white metal in Colombian rivers during the 16th century, they were actually quite annoyed by it. They were there hunting for gold, and this silvery stuff kept getting mixed in with their precious finds. Since it looked like silver but was much harder to work with (requiring much higher temperatures to melt), they dismissively called it "platina del Pinto" – meaning "little silver of the Pinto River." The Spanish considered it so worthless that they often threw it back into the rivers, and there were even laws requiring it to be mixed with gold to prevent counterfeiting! It wasn't until the 18th century that European scientists realized this "annoying impurity" was actually rarer (and in for some more valuable) than gold itself.
Platinum Breaks Out — Palladium Follows
However, the reason that I’m describing platinum today is not due to the interesting history of its name. It’s because this precious metal just soared in a particular way.
Palladium jumped higher as well, but it is the rally in platinum that got heads turning. In other words, platinum is currently hot, and it tells us something important.
Many things change on the markets and in methodologies, but one thing remains intact – whenever something “feels” super urgent or when it looks like the train is leaving the station and you just have to react, it’s usually good not to react, but to respond – meaning to take action (or not to take it) after taking some time to consider what’s going on and what happened on previous occasions when we saw the same thing on a given market. The current rally in platinum is no exception from this rule.
Let’s investigate.
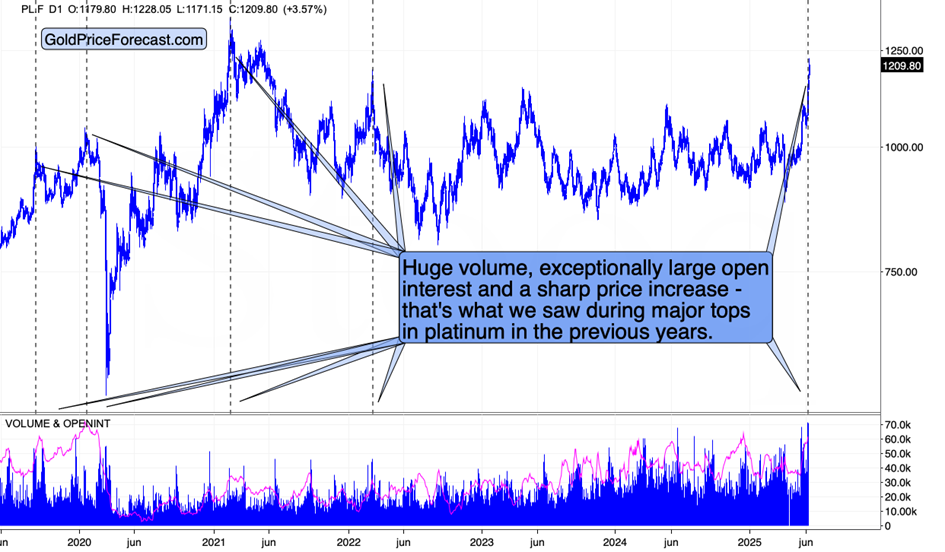
Platinum price is up sharply today after rallying sharply also last week. All this while the volume is huge, and the open interest on the futures market is also very significant.
Current Spike Echoes 2020’s Collapse
When did this happen in the previous years? There were two times when we saw all three align in a similar way, and one of them was more similar than the other. The key analogy is to the early 2020 top – that’s when we saw THE top that preceded THE slide.
The second most important analogy is to the late-2019 top, before the above-mentioned top. The open interest was not as big, and the rally was also not that huge.
Still, declines follow shortly in both cases.
The remaining two cases are where we have similarities in terms of price moves (after sharp rallies) and in terms of volume (it spiked), but not in terms of open interest. Platinum declined after both times, anyway.
Interestingly, two of the above four situations are also characterized by similar price/volume action in palladium.
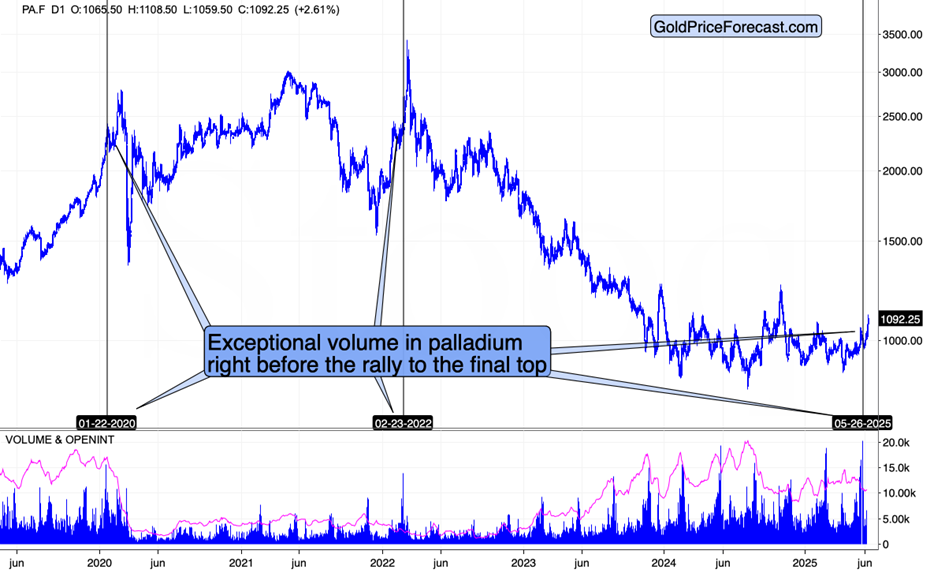
The early-2020 spike in volume and the 2022 spike in volume were both followed by the rallies to final tops. And it’s not now that we see the volume spike in palladium – we already saw it some time ago, further confirming the case that THIS is the final rally before the slide.
What’s important here is that both metals rallied “just like that” – there was no major fundamental shift in any of them. No change in the supply or demand. No key news from the automotive industry (both are used there). The only thing that made those metals rally recently is the very bullish sentiment among investors.
Remember what I wrote about copper in Friday’s Gold Trading Alert? Let me quote it just in case:
“It’s the chart featuring copper, but – at the risk of sounding arrogant – I’ll call it the delusion indicator.
The fundamental (tariffs and their implications on world trade) and medium-term technical outlooks for copper are terrible. And yet, copper futures just (yesterday) soared above the 500 level. The move was invalidated on the same day right after copper futures touched the 78.6% Fibonacci retracement, and now copper is back below its late-April high.
This provides key context for silver’s rally. Was that white metal’s internal strength? No – it was likely the same wave of buyers that bought copper. The difference is that since silver’s situation is better than the one of copper, silver’s rally was not (yet) invalidated.
Given all that I wrote so far today, silver’s “strength” should seem suspicious.”
Looking at platinum and palladium, it looks like those buyers are the investment public buying whatever they found to be cheap. And yes, as you saw on platinum’s chart, this usually doesn’t end well.
What’s remarkable is that the times when platinum soared on a short-term basis, were also the times when silver topped.
In most cases, gold topped as well, but the “platinum sign” was particularly useful in the case of silver – its big sister metal.
All in all, while platinum’s surge might appear like a game-changer and something that has bullish implications, the reality is that when we saw something like that, declines – not rallies – followed.
Trading in financial instruments and/or cryptocurrencies involves high risks including the risk of losing some, or all, of your investment amount, and may not be suitable for all investors. Prices of cryptocurrencies are extremely volatile and may be affected by external factors such as financial, regulatory or political events. Trading on margin increases the financial risks.
Before deciding to trade in financial instrument or cryptocurrencies you should be fully informed of the risks and costs associated with trading the financial markets, carefully consider your investment objectives, level of experience, and risk appetite, and seek professional advice where needed.
Fusion Media would like to remind you that the data contained in this website is not necessarily real-time nor accurate. The data and prices on the website are not necessarily provided by any market or exchange, but may be provided by market makers, and so prices may not be accurate and may differ from the actual price at any given market, meaning prices are indicative and not appropriate for trading purposes. Fusion Media and any provider of the data contained in this website will not accept liability for any loss or damage as a result of your trading, or your reliance on the information contained within this website.
It is prohibited to use, store, reproduce, display, modify, transmit or distribute the data contained in this website without the explicit prior written permission of Fusion Media and/or the data provider. All intellectual property rights are reserved by the providers and/or the exchange providing the data contained in this website.
Fusion Media may be compensated by the advertisers that appear on the website, based on your interaction with the advertisements or advertisers.