Is NASDAQ 100's Bounce Under Way?
Dr. Arnout ter Schure | Sep 22, 2020 02:04PM ET
As usual, let's review what was anticipated and what was realized to assess what was right, wrong and to adjust if necessary.
Last week I anticipated, "a larger bounce is now under way to ideally $11,505-11,860. From there, I expect the next leg lower to complete larger (black) wave-4. Wave-5 should then rally the index back to new all-time highs and to complete the bull that started in 2009 in the spring of 2021."
And found, "… as long as the NDX stays below $12,250, I expect the current counter-trend rally to fizzle out in the [11505-11860] target zone. After that, it should work its way lower into, preferably, the pink target zone ($10000-10500). But, as we have seen over the last few weeks, in Bull markets, "upside surprises and downside disappoints." So, please do not be surprised if only the black target zone at $10,250-10,750 is reached for the larger wave-4."
That same day the Nasdaq 100 topped at $11,495 and started its decline to yesterday's low at $10,678. Thus, the index missed the ideal bounce target zone by 10p (0.1%... pardon the market's inaccuracy…), and so far bottomed in the "do not be surprised zone" of $10,250-10,750 yesterday. It missed the purple target zone by only 178p (1.7%) but reached the shorter symmetry-based target.
Thus, the question is: Did wave-4, therefore, already bottom?
It is possible, but the failure of the index to reach the purple target zone suggests to me it may have one more twist and turn in place. It would also fit with the average annual U.S. election year pattern (see Figure 2 of my recent article about the S&P500: https://www.investing.com/analysis/sp-500-is-it-the-1970s-all-over-again-200536945 ). This pattern has a bottom by the 3rd week of September, a counter-trend rally into late-September, and then a further decline into mid- to late-October.
Figure 1.
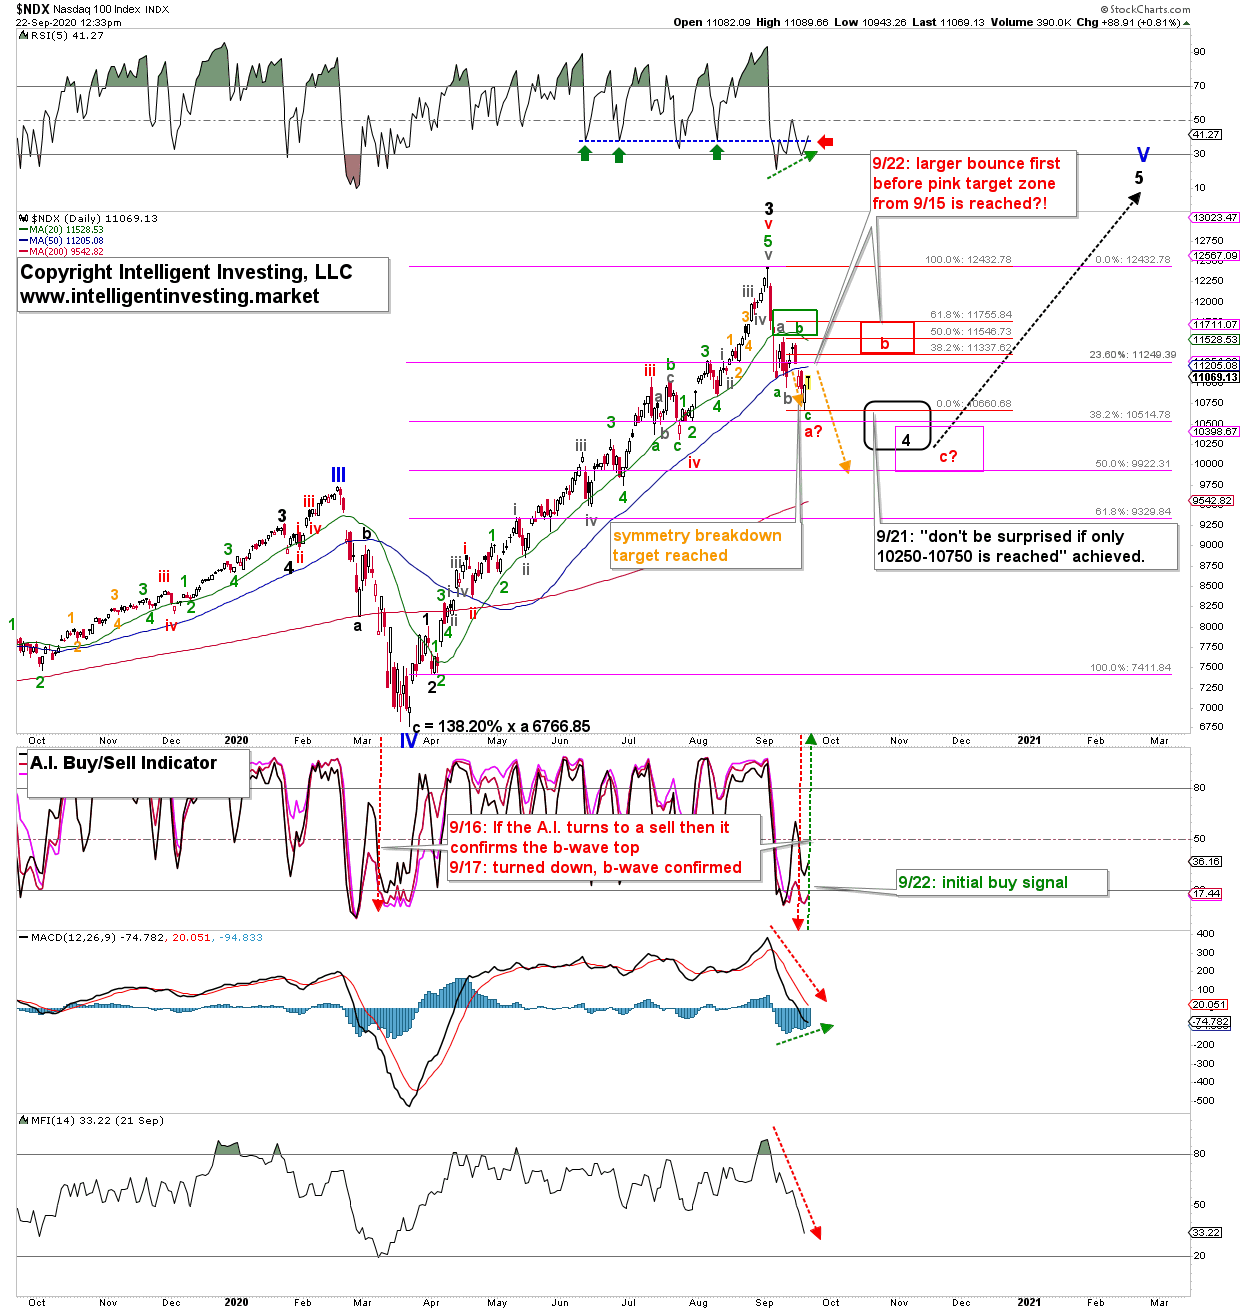
This "twist and turn" would be red wave-b and -c, as shown in Figure 1. The former, a counter-trend rally, should ideally top around 11335-11755 before wave-c moves the index to the ideal (purple) target zone of 10000-10500. Once wave-b is confirmed, I can then further adjust the ideal wave-c target zone as I am still trying to look around 2-3 corners simultaneously, which leads to increased uncertainty.
For now, the daily chart is giving some positive signals, with my proprietary AI buy/sell indicator turning back up, and some divergence on the daily RSI5 (green dotted arrows). I prefer to see a strong close today and, additionally, a close above the 50-day Simple Moving Average to add further weight to the evidence this path is unfolding.
A close below today's low, followed by a close below yesterday's low, will force me to adjust my current perspective in that wave-a is still unfolding. Thus, we have exact, simple, cut-off levels to know which it will be. These can very easily be applied in one's daily trading decisions for buy and stop triggers. That is the beauty of the Elliott Wave Principle, combined with Technical Analyses.
Trading in financial instruments and/or cryptocurrencies involves high risks including the risk of losing some, or all, of your investment amount, and may not be suitable for all investors. Prices of cryptocurrencies are extremely volatile and may be affected by external factors such as financial, regulatory or political events. Trading on margin increases the financial risks.
Before deciding to trade in financial instrument or cryptocurrencies you should be fully informed of the risks and costs associated with trading the financial markets, carefully consider your investment objectives, level of experience, and risk appetite, and seek professional advice where needed.
Fusion Media would like to remind you that the data contained in this website is not necessarily real-time nor accurate. The data and prices on the website are not necessarily provided by any market or exchange, but may be provided by market makers, and so prices may not be accurate and may differ from the actual price at any given market, meaning prices are indicative and not appropriate for trading purposes. Fusion Media and any provider of the data contained in this website will not accept liability for any loss or damage as a result of your trading, or your reliance on the information contained within this website.
It is prohibited to use, store, reproduce, display, modify, transmit or distribute the data contained in this website without the explicit prior written permission of Fusion Media and/or the data provider. All intellectual property rights are reserved by the providers and/or the exchange providing the data contained in this website.
Fusion Media may be compensated by the advertisers that appear on the website, based on your interaction with the advertisements or advertisers.