Is Equities Only Put/Call Ratio Warning of Extreme Complacency?
Dr. Arnout ter Schure | May 21, 2020 02:27PM ET
Sentiment can be a beautiful and useful contrarian indicator as markets tend to punish the majority: If everybody is bullish and has bought longs, then only selling is left. If everybody is bearish and has sold, then only buying is left.
One of the best direct measures of sentiment is the put/call ratio (P/C). It reflects “put your money where your mouth is,” as the ratio is based on the actual number/volume of puts and calls being bought
each day. Questionnaires and surveys about one’s point of view of the market on the other hand often only express an opinion and not necessarily one’s action.
Over the last three days, the Equites Only Put/Call ratio (OE-P/C) has been 0.49, 0.46 and 0.47 (source: https://markets.cboe.com/us/options/market_statistics/daily/). These are rather low readings. It
means for every put that was bought, more than two calls were bought. Hence, market participants were getting very bullish expecting the markets to move higher and higher. The chart below shows the last
time the EO-P/C dropped below 0.5 was in mid-November 2019 (dotted black vertical line). That was the first time it did this since the Dec. 24, 2018, low was put in place. The reward then was10% three
months later. The downside risk was almost 30% four months later. Not a good risk/reward ratio. Yet, here we are again at the same ratio, but now only two months after a historic low was put in, while back
in November the market had already rallied for almost one year. Are market participants getting too bullish?
Figure 1: Equities Only Put/Call ratio (EO-P/C) and S&P500 performance last seven months:
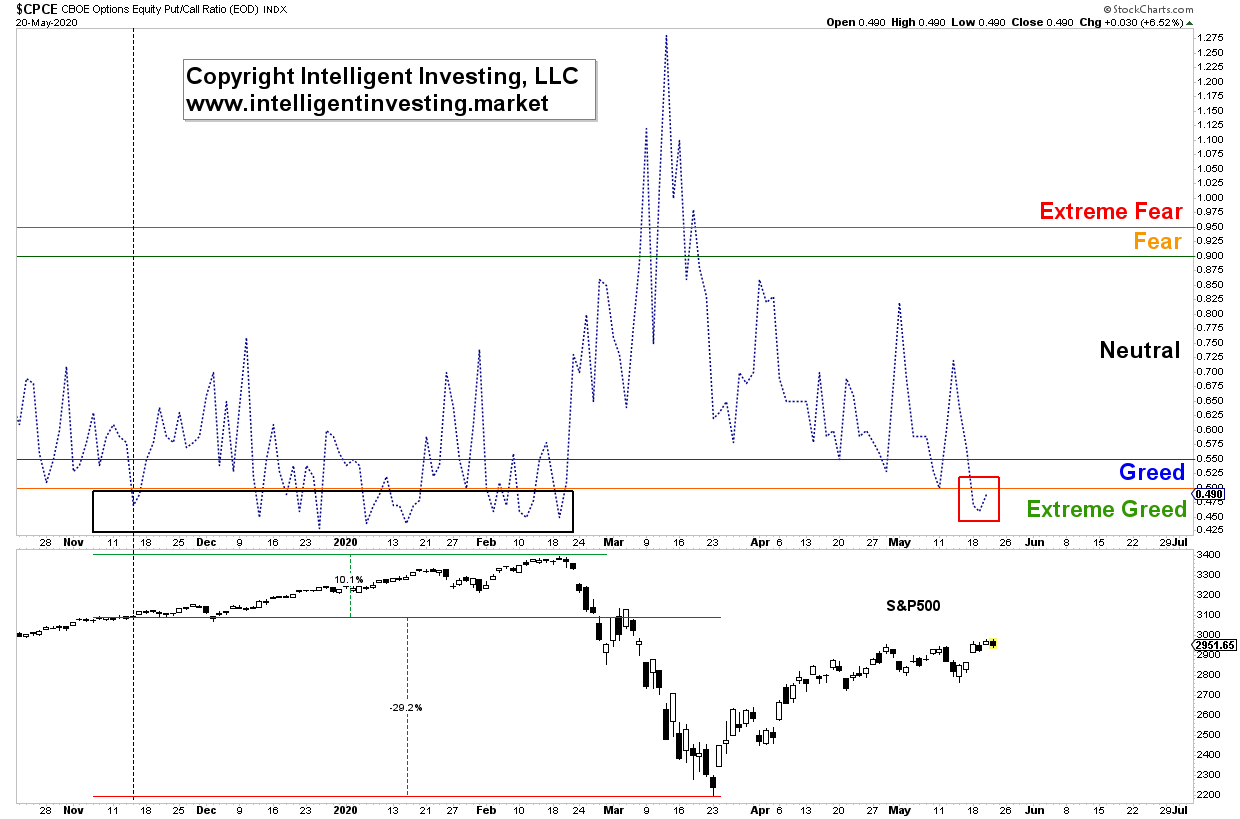
Figure 1 shows one of the main problems with a P/C is that it is noisy because the data is daily. Using a moving average smooths out the daily variations. I applied a 10-day exponential moving average (10d
EMA) to the data and overlaid it with the S&P 500. EO-P/C data is only available since late-2003 and, therefore, captures two bull markets (2003-2007 and 2009-2020) and one bear market (2007-2009). It is not a whole lot to go by, but for now it will have to do. See Figure 2 below.
Figure 2: Equities Only Put/Call ratio (EO-P/C) and S&P500 performance since 2003
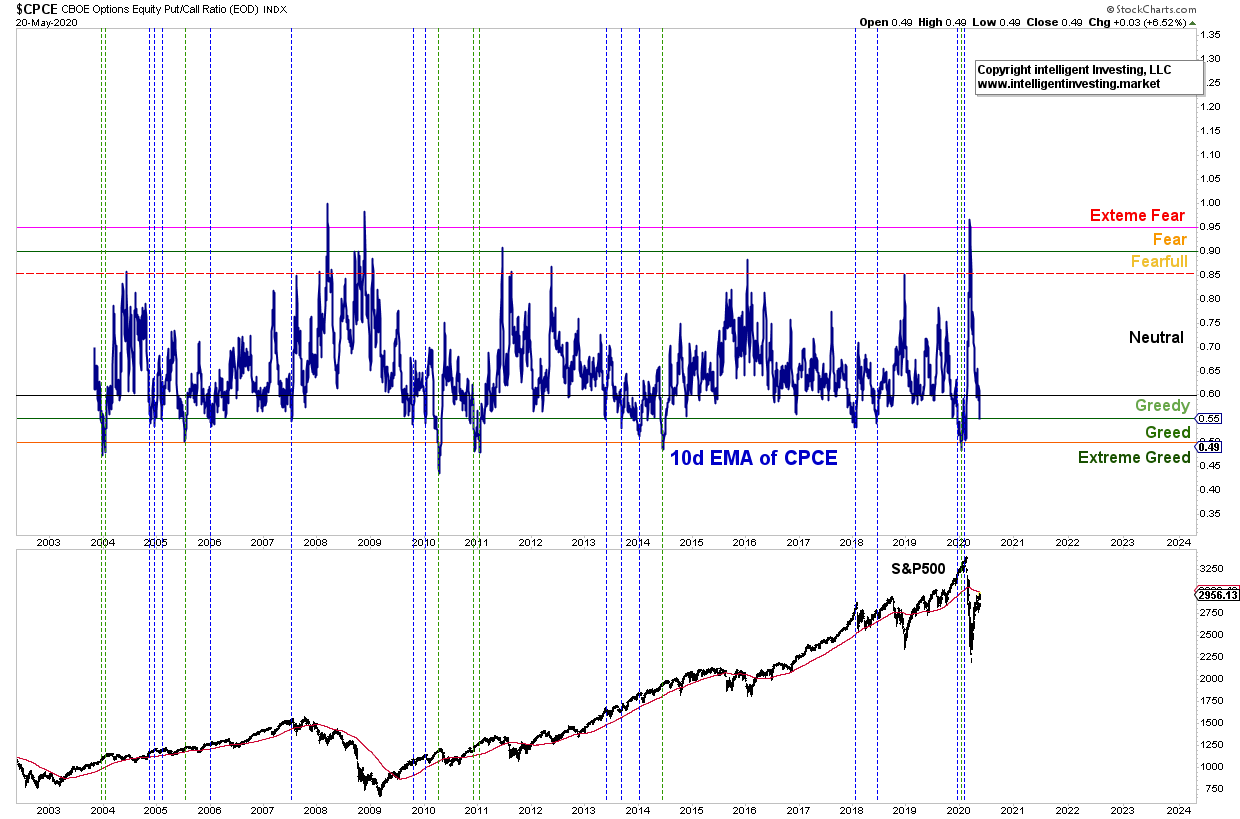
What I find is the 10d EMA of the EO-P/C dropped below 0.55 today. Is that bad for the stock market?
Let us check the other times it moved below 0.55: dotted blue vertical lines. In most cases a correction was imminent before the bull market resumed for many more months: late 2004, early 2005, late 2009,
2013, mid-2019.
In other cases, the market topped or was close to a significant-top: mid-2007, early 2018 and early 2020.
The EO-P/C can move even lower, to below 0.50 as shown by the dotted green vertical lines. For those instances I find the same as for the less than 0.55 of cases: either a correction and then higher (late 2003, mid-2005, late 2010, early 2011, mid-2015) or close to a significant market top (early 2010 and early 2020).
Based on the data, I must conclude the market is most likely close to a correction, either big or small. But I want to add one more filter. The 200d SMA for the S&P 500: The red line in the chart of the
S&P 500. Namely, in all the above cases the S&P 500 was above its 200d SMA. (2004, 2005, 2006, 2007, 2009, 2010, 2011, 2013, 2014, 2018, 2019 and 2020). Since early March (almost three months now) the S&P 500 has been trading below its 200d SMA (SPX2999). The only times since 2003 the S&P 500 was below its 200d SMA for a prolonged period was 2008 through mid-2009, mid-2010, mid-2011 though to the end of 2011, mid-2015 through to early 2016, late 2018 through to early 2019, and currently.
But in all these prior cases the 10d EMA of the EO-P/C never moved below 0.55. It stayed mostly above 0.60. Thus, the current low P/C reading is unique. Especially if I define a bear market when the S&P500 is trading below its 200d SMA. That means the current rally off the March low is a bear market rally until proven otherwise.
Subsequently, if most market participants are betting on a continued rally while the EO-P/C chart tells odds favor at least a correction and the S&P 500 chart tells of a bear market rally, then it is
logical to conclude the Equities Only Put/Call ratio is warning of extreme complacency.
Trading in financial instruments and/or cryptocurrencies involves high risks including the risk of losing some, or all, of your investment amount, and may not be suitable for all investors. Prices of cryptocurrencies are extremely volatile and may be affected by external factors such as financial, regulatory or political events. Trading on margin increases the financial risks.
Before deciding to trade in financial instrument or cryptocurrencies you should be fully informed of the risks and costs associated with trading the financial markets, carefully consider your investment objectives, level of experience, and risk appetite, and seek professional advice where needed.
Fusion Media would like to remind you that the data contained in this website is not necessarily real-time nor accurate. The data and prices on the website are not necessarily provided by any market or exchange, but may be provided by market makers, and so prices may not be accurate and may differ from the actual price at any given market, meaning prices are indicative and not appropriate for trading purposes. Fusion Media and any provider of the data contained in this website will not accept liability for any loss or damage as a result of your trading, or your reliance on the information contained within this website.
It is prohibited to use, store, reproduce, display, modify, transmit or distribute the data contained in this website without the explicit prior written permission of Fusion Media and/or the data provider. All intellectual property rights are reserved by the providers and/or the exchange providing the data contained in this website.
Fusion Media may be compensated by the advertisers that appear on the website, based on your interaction with the advertisements or advertisers.