S&P 500: Expected Pullback Has Arrived - Rally Time?
Dr. Arnout ter Schure | Jan 20, 2023 01:41PM ET
In our update from last week for the S&P 500 (SPX), see here, we "anticipate[d] a red W-ii soon, ideally down to $3875+/-25, before the red W-iii to ideally $4275+/-50 kicks in."
Back then, the index was at $3997. It topped at $4015 earlier this week and dropped to $3885 yesterday. So far, so good. Now the index is staging a rally. Thus, the main question is whether the correction is complete or not.
Before we answer that question, for those not familiar with my work, I primarily use the Elliott Wave Principle (EWP) in combination with technical analyses to assess the market's next most likely moves and where it should top and bottom with a reasonable margin of error. As such, our primary expectation has been for many weeks:
"Once the $3800+/-70 zone is reached, …, we must entertain the notion all of black W-b has already bottomed out. From there, we anticipated the more significant c-wave rally to $4300+." See Figure 1 below. Note C waves comprise five waves. In this case, the red W-i, ii, iii, iv, and v in Figure 1. Moreover, red W-i, iii, and v are made up of five smaller (green) waves, 1-2-3-4-5, whereas red W-ii and iv comprise three waves, a-b-c, showing the fractal nature of the financial markets."
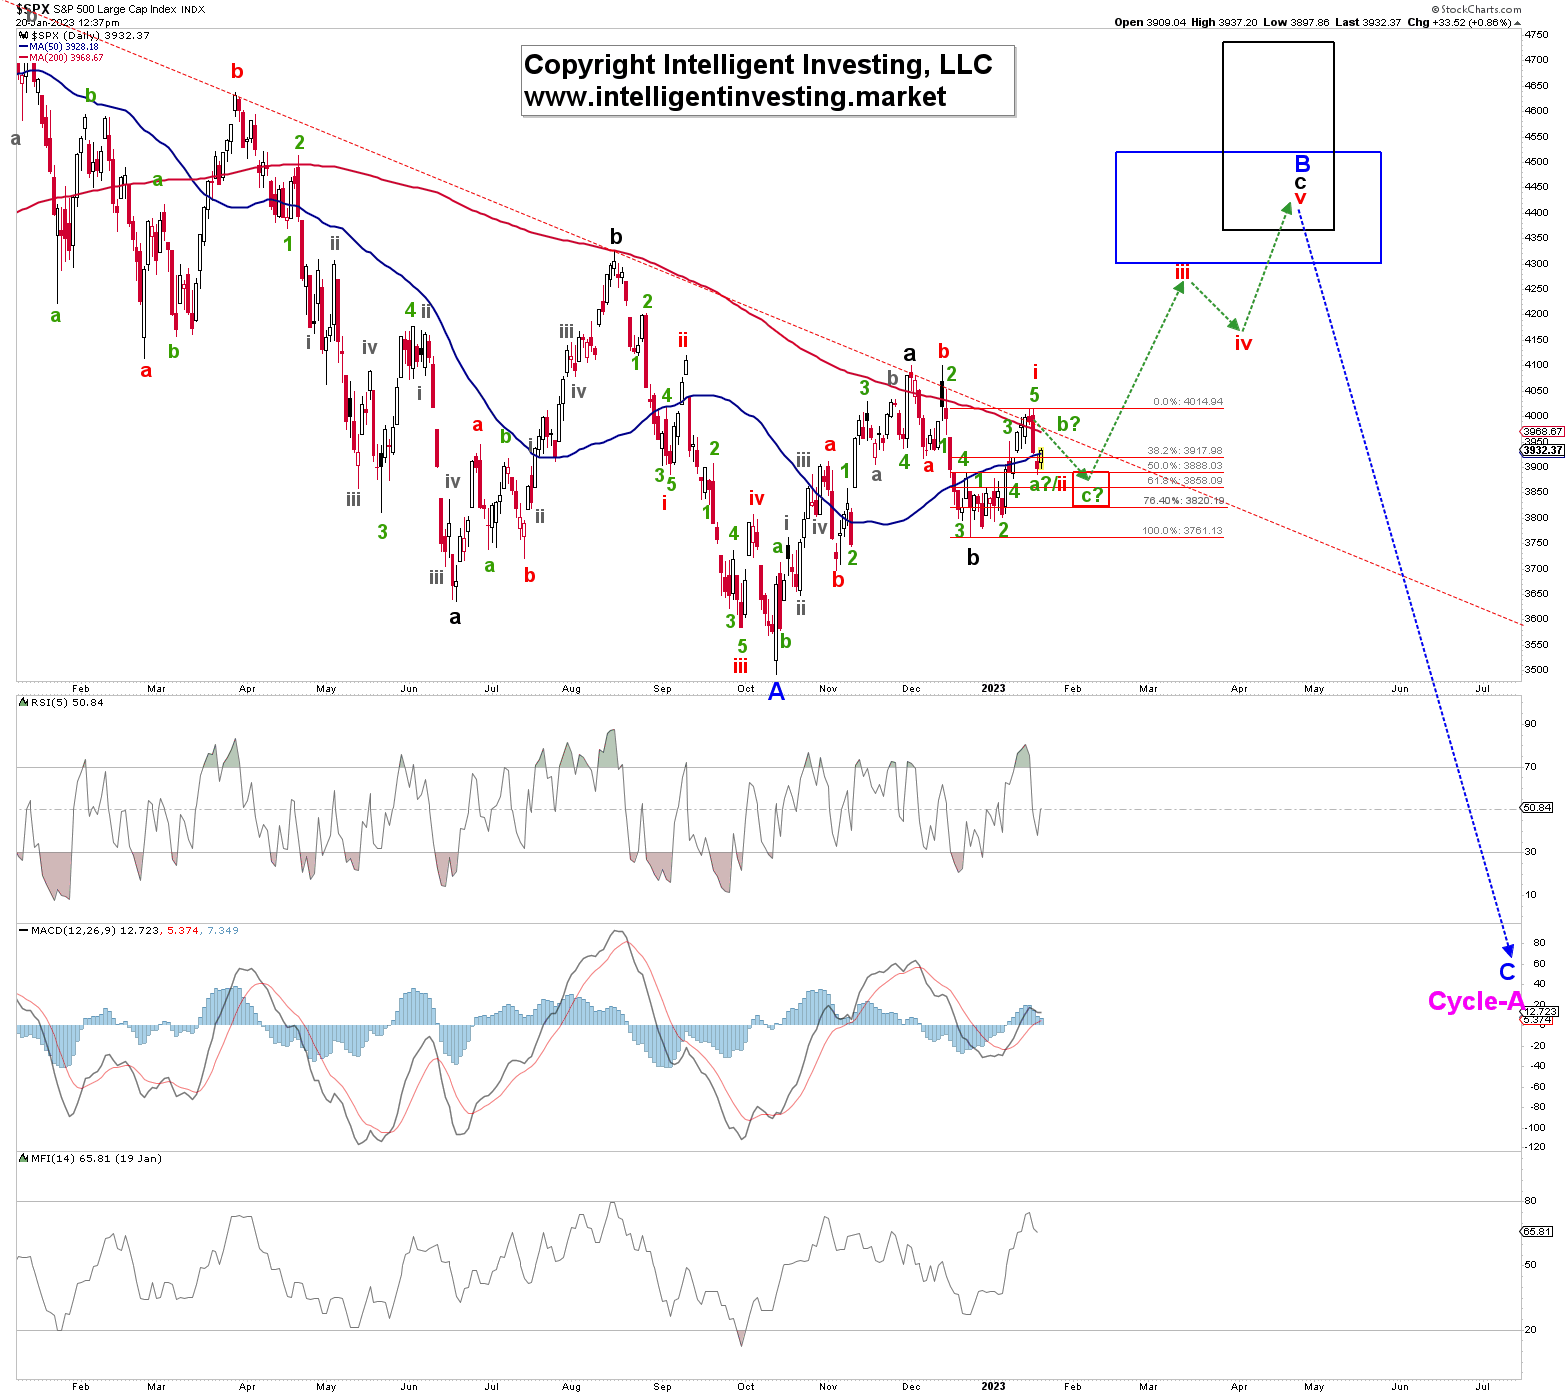
The SPX bottomed at $3764 on December 22, 2022, for black W-b and rallied in five smaller (green) waves to $4015 earlier this week for red W-i. Because of these five smaller waves, we knew that a pullback was imminent. Besides, typically a 2nd wave retraces between 50-76% of the previous 1st wave; hence, why I called for a pullback soon to $3875+/-25 last week.
With yesterday's low at $3884, which is the 50% retrace of red W-i, the index has technically done enough to consider the correction complete. However, the green "a?, b?, c?" labels show we cannot yet dismiss red W-ii becomes more pronounced and subdivided. It can now be in green W-b to around $3950+/-25 before green W-c down to $3820-50 takes hold. But, if the index closes above this week's high, then red W-iii is essentially confirmed, barring an irregular flat W-ii. A drop below yesterday's low from the $3950+/-25 zone signals green W-c? is in progress.
Thus, our conclusion from last week: "… unless the index breaks back below the December 22 low, with a first warning below $3850, there is no reason for this [Bullish, dip-rally] pattern not to unfold, and the following multi-day correction should be considered a low-risk buying opportunity," was correct.
It is a matter of "all of W-ii is complete" vs. "W-ii will become more complex." We will know soon enough as such detail cannot be elucidated yet based on the limited price data available. But for now, I prefer to look higher short- to intermediate-term. Once SPX4300+ is reached, I will become much more cautious in anticipation of the blue C wave.
Trading in financial instruments and/or cryptocurrencies involves high risks including the risk of losing some, or all, of your investment amount, and may not be suitable for all investors. Prices of cryptocurrencies are extremely volatile and may be affected by external factors such as financial, regulatory or political events. Trading on margin increases the financial risks.
Before deciding to trade in financial instrument or cryptocurrencies you should be fully informed of the risks and costs associated with trading the financial markets, carefully consider your investment objectives, level of experience, and risk appetite, and seek professional advice where needed.
Fusion Media would like to remind you that the data contained in this website is not necessarily real-time nor accurate. The data and prices on the website are not necessarily provided by any market or exchange, but may be provided by market makers, and so prices may not be accurate and may differ from the actual price at any given market, meaning prices are indicative and not appropriate for trading purposes. Fusion Media and any provider of the data contained in this website will not accept liability for any loss or damage as a result of your trading, or your reliance on the information contained within this website.
It is prohibited to use, store, reproduce, display, modify, transmit or distribute the data contained in this website without the explicit prior written permission of Fusion Media and/or the data provider. All intellectual property rights are reserved by the providers and/or the exchange providing the data contained in this website.
Fusion Media may be compensated by the advertisers that appear on the website, based on your interaction with the advertisements or advertisers.