Inverse Exchange-Traded Funds Versus Shorting Stocks
Dr. Alan Ellman | Apr 08, 2018 01:00AM ET
In bear markets, one of the tools we can benefit from with our covered call writing and put-selling strategies is inverse exchange-traded funds (ETFs). An inverse ETF is also known as a short ETF or a bear ETF. These securities are constructed to return the exact opposite performance of a certain benchmark or index. Many investors consider inverse ETFs the same as short-selling stocks, where shares are borrowed and sold at the current price in expectation of buying them back at lower price thereby generating a credit. We will not focus in on leveraged inverse ETFs because I feel they are not appropriate for most retail investors using these conservative option-selling strategies. This article will explain the mechanism of inverse ETFs and highlight the pros and cons of each investment approach.
How do inverse ETFs work?
These securities use derivatives and positions in multiple securities such that the daily gain or loss is the inverse of the traditional index. If the S&P 500 is up 2% in one day, its inverse ETF would be down 2% that same day. Each trading day the inverse ETF rebalances its investments to maintain a constant leverage ratio so the relationship between it and the associated benchmark or index will line up over the short-term but usually not longer time frames.
Disconnect between inverse ETFs and shorting results: hypothetical example
- Index starts at $1000.00
- After week #1, it drops to $900.00
- After week #2, it drops to $800.00
- After week #3, it returns to $1000.00
Results from shorting the stock (ETF)
The shares are sold at $1000.00 and bought back at $1000.00, so there no loss or gain outside of fees.
Results from using an inverse ETF
- After week #1, the value of the security is up 10% to $1100.00 (as the index declines by 10%)
- After week #2, the value of the inverse security is up 11.11% (resulting from the share decline from $900 to $800.00) to $1222.00
- After week #3, the value of the security is down 25% (resulting from share appreciation from $800.00 to $1000.00) to $916.50
In this hypothetical, the inverse ETF results in a loss of $83.50 compared to the breakeven of short-selling. In the long-term, inverse ETFs tend to under-perform due to daily re-balancing of these securities.
Other factors to consider
Both strategies take advantage of declining markets but only inverse ETFs can be used in conjunction with our option-selling strategies. On the negative side, inverse ETFs come with expense ratios averaging 1%.
Short-selling will better match dollar-for-dollar the longer-term movement of the index or benchmark but short-sellers would be responsible for payment of stock dividends in certain circumstances and may be susceptible to margin call. Here is a chart summarizing the pros and cons of each strategy:
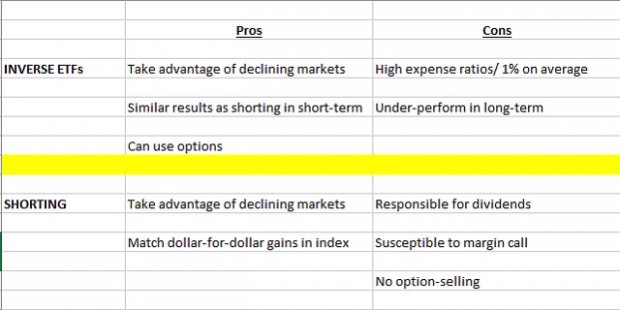
Some might add that another advantage of inverse ETFs is that the maximum loss is limited to the cost of the shares whereas there is unlimited loss potential with shorting because share price can theoretically move to infinity. This assumes that there is no exit strategy opportunities executed and that simply does not apply to The Blue Collar Investor community.
Discussion
Inverse ETFs have a place in our short-term option-selling strategies. They are appropriate in confirmed bear markets (2008 was a perfect year for these securities) where we can sell out-of-the-money calls and puts to generate income. It is instructive to understand that short-selling is not the same as buying inverse ETFs.
New webinar available to premium and video members later this month
Covered Call Writing with Buy-And-Hold Stocks
Real-life examples in a bear market environment
I created a real-life $100k portfolio to demonstrate actual transactions in my brokerage account demonstrating how to trade in a bear-market environment using Dow 30 stocks in a long-term buy-and-hold portfolio. Charts were created for the underlyings to graphically better understand the timing of these trades.
Market tone
This week’s economic news of importance:
- Markit manufacturing PMI March 55.6 (expansion)
- ISM manufacturing index March 59.3% (60% expected)
- Construction spending February 0.1% (0.4% expected)
- ADP employment March 241,000 (last 246,000)
- Markit services PMI March 54.0 (54.1 last)
- ISM non-manufacturing index March 58.8% (59% expected)
- Weekly jobless claims 3/31 242,000 (225,000 expected)
- Trade deficit February (-) 57.6 billion (57.4 billion expected)
- Non-farm payrolls March 103,000 (170,000 expected)
- Unemployment rate March 4.1% (4.0% expected)
- Average hourly earnings March 0.3% (expected)
THE WEEK AHEAD
Mon April 9th
- None scheduled
Tue April 10th
- Producer price index March
- Wholesale inventories February
Wed April 11th
- Consumer price index March
- Core CPI March
- Federal budget March
- FOMC minutes
Thu April 12th
- Weekly jobless claims through 4/7
Fri April 13th
- Job openings February
- Consumer sentiment index
For the week, the S&P 500 fell by 1.38% for a year-to-date return of (-) 2.59%%
Summary
IBD: Market in correction
GMI : 1/6- Sell signal since market close of March 23, 2018
BCI: Selling all in-the-money strikes for all new positions. Currently fully invested and rolling down to out-of-the-money strikes (as they relate to current market value) when opportunities arise. Will re-adjust when the market settles.
WHAT THE BROAD MARKET INDICATORS (S&P 500 AND VIX) ARE TELLING US
The 6-month charts point to a bearish sentiment. In the past six months, the S&P 500 was up 2% while the VIX (21.41) moved up by 125%. Historically, the VIX and S&P 500 are inversely related.
Wishing you much success,
Original post
Trading in financial instruments and/or cryptocurrencies involves high risks including the risk of losing some, or all, of your investment amount, and may not be suitable for all investors. Prices of cryptocurrencies are extremely volatile and may be affected by external factors such as financial, regulatory or political events. Trading on margin increases the financial risks.
Before deciding to trade in financial instrument or cryptocurrencies you should be fully informed of the risks and costs associated with trading the financial markets, carefully consider your investment objectives, level of experience, and risk appetite, and seek professional advice where needed.
Fusion Media would like to remind you that the data contained in this website is not necessarily real-time nor accurate. The data and prices on the website are not necessarily provided by any market or exchange, but may be provided by market makers, and so prices may not be accurate and may differ from the actual price at any given market, meaning prices are indicative and not appropriate for trading purposes. Fusion Media and any provider of the data contained in this website will not accept liability for any loss or damage as a result of your trading, or your reliance on the information contained within this website.
It is prohibited to use, store, reproduce, display, modify, transmit or distribute the data contained in this website without the explicit prior written permission of Fusion Media and/or the data provider. All intellectual property rights are reserved by the providers and/or the exchange providing the data contained in this website.
Fusion Media may be compensated by the advertisers that appear on the website, based on your interaction with the advertisements or advertisers.