Inflation: An X-Ray View Of The Components
Doug Short | Feb 16, 2017 01:07AM ET
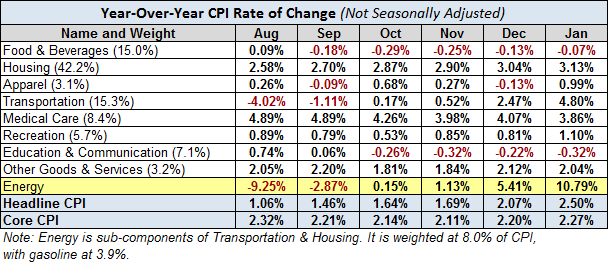
Here is a table showing the annualized change in Headline and Core CPI, not seasonally adjusted, for each of the past six months. Also included are the eight components of Headline CPI and a separate entry for Energy, which is a collection of sub-indexes in Housing and Transportation.
We can make some inferences about how inflation is impacting our personal expenses depending on our relative exposure to the individual components. Some of us have higher transportation costs, others medical costs, etc.
A conspicuous feature in the year-over-year table is the volatility in energy, significantly a result of gasoline prices, which is also reflected in Transportation.
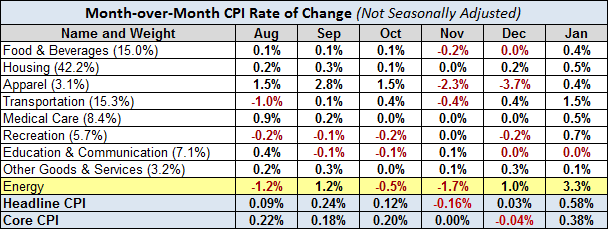
Here is the same table with month-over-month numbers (not seasonally adjusted).
The Trends in Headline and Core CPI
The chart below shows Headline and Core CPI for urban consumers since 2007. Core CPI excludes the two most volatile components: food and energy. We've highlighted the 2% level that the Federal Reserve is targeting for inflation, although the Fed traditionally uses the Personal Consumption Expenditure (PCE) price index as their preferred inflation gauge.
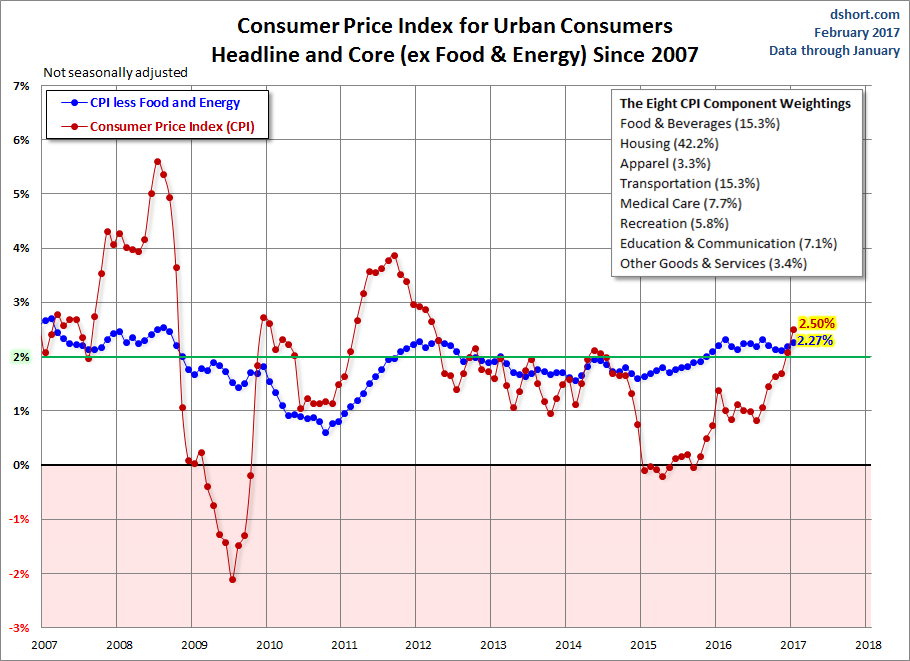
Year-over-year Core CPI (the blue line) has been above 2% since the end of 2015 after about three years below that benchmark. The more volatile Headline CPI has spent most of the previous five years under the 2% lower benchmark, and much of the volatility in this metric has been the result of broad swings in gasoline prices (more on gasoline here ).
For a longer-term perspective, here is a column-style breakdown of the inflation categories showing the change since 2000.
Note: For additional information on the component composition of the Consumer Price Index, see our Inside the Consumer Price Index .
Trading in financial instruments and/or cryptocurrencies involves high risks including the risk of losing some, or all, of your investment amount, and may not be suitable for all investors. Prices of cryptocurrencies are extremely volatile and may be affected by external factors such as financial, regulatory or political events. Trading on margin increases the financial risks.
Before deciding to trade in financial instrument or cryptocurrencies you should be fully informed of the risks and costs associated with trading the financial markets, carefully consider your investment objectives, level of experience, and risk appetite, and seek professional advice where needed.
Fusion Media would like to remind you that the data contained in this website is not necessarily real-time nor accurate. The data and prices on the website are not necessarily provided by any market or exchange, but may be provided by market makers, and so prices may not be accurate and may differ from the actual price at any given market, meaning prices are indicative and not appropriate for trading purposes. Fusion Media and any provider of the data contained in this website will not accept liability for any loss or damage as a result of your trading, or your reliance on the information contained within this website.
It is prohibited to use, store, reproduce, display, modify, transmit or distribute the data contained in this website without the explicit prior written permission of Fusion Media and/or the data provider. All intellectual property rights are reserved by the providers and/or the exchange providing the data contained in this website.
Fusion Media may be compensated by the advertisers that appear on the website, based on your interaction with the advertisements or advertisers.