Bitcoin: Indicator Divergence
Korbinian Koller | Mar 18, 2020 05:04AM ET
With a vast following of market speculators, we receive a consistent inflow of questions and comments about the market. One phenomenon seems striking. The fact that most find taking the “easy” trades hardest and simply skip them. We strongly discourage such behavior. There is no evidence that trades that “look too good to be true” have a diminished statistical edge. Quite the opposite, altering a systematical approach in skipping easy to identify (“beautiful” trades) signals, will have a negative effect on one's overall performance. Indicator divergence is one such stack-able edge that at times is unmistakably present to one's observation.
As with any other edge it should not be traded isolated. And, in principle, the outcome of the trade is still random from an individual trade perspective. Leaving clear signals out is negative curve fitting and should be avoided. So the next time you see an indicator divergence like the following, just trade them alike the lesser pronounced ones.
Price In Sideways Range
Daily chart, BTC/USDT, October 6th 2019
In the chart above, one can identify a two weeks sideways price trading range. The US$7,800 price zone in Bitcoin is representing support. While prices go sideways the Commodity Channel Index indicator shows a clear divergence with higher readings.
Positive Indicator Divergence
BTC/USDT, daily chart, October 11th 2019
Five days later the bitcoin market had advanced by 1,000 points.
Price Trending Down
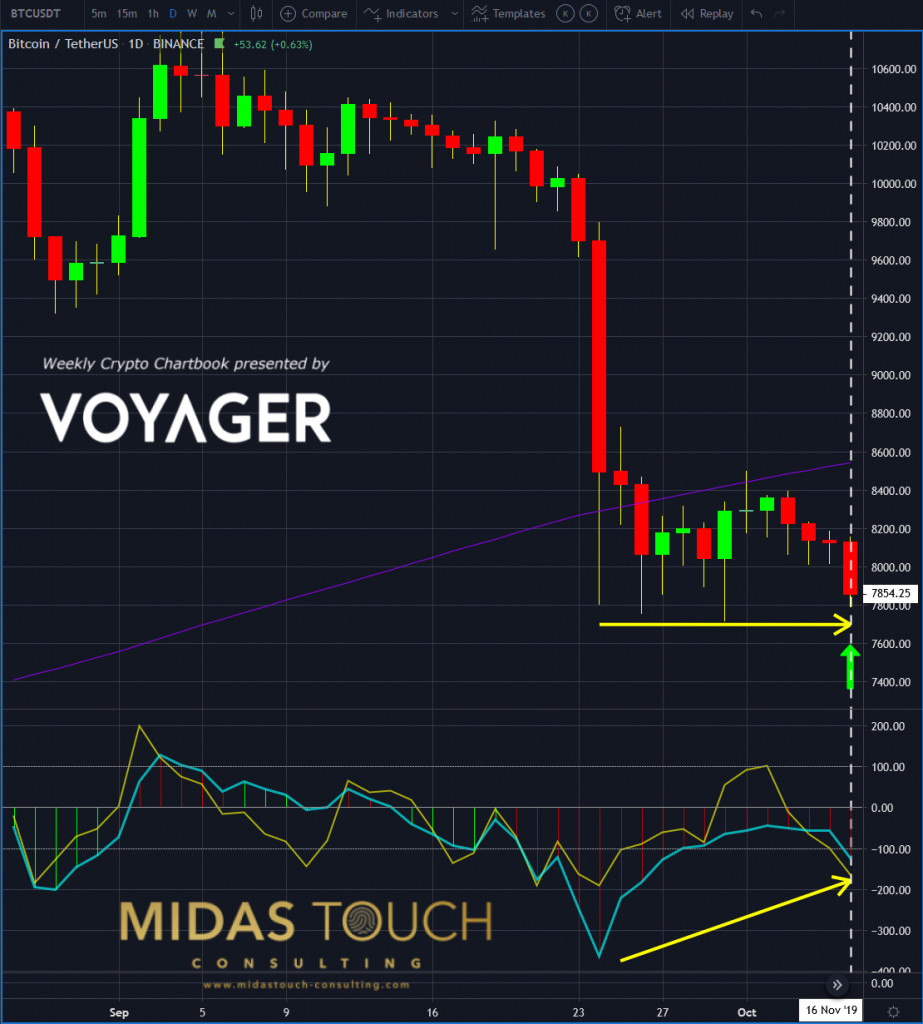
11/16/2019, BTC/USDT, daily chart
This daily chart shows a price decline over the last nine trading days. Upon other reasons, we went long due to a clear indicator divergence present in the Commodity channel index indicator, which was moving in the opposite direction.
Indicator Sloping Upwards
BTC/USDT, daily chart, November 17th 2019
The following day immediate price advances allowed for taking the risk out of the trade. What is left is potential (green up arrow) without risk. A trader's ideal scenario to play with the markets money.
Indicator divergence
If you have to squint to see an edge on an indicator, you might skip overtaking a trade. An edge should be clearly identifiable.
On the other hand, skipping a trade, just because it looks “too good to be true” has no merit. By defining ones edges as clearly as possible and than executing a trade upon its appearance without hesitancy, one assures a consistent outcome.
Trading in financial instruments and/or cryptocurrencies involves high risks including the risk of losing some, or all, of your investment amount, and may not be suitable for all investors. Prices of cryptocurrencies are extremely volatile and may be affected by external factors such as financial, regulatory or political events. Trading on margin increases the financial risks.
Before deciding to trade in financial instrument or cryptocurrencies you should be fully informed of the risks and costs associated with trading the financial markets, carefully consider your investment objectives, level of experience, and risk appetite, and seek professional advice where needed.
Fusion Media would like to remind you that the data contained in this website is not necessarily real-time nor accurate. The data and prices on the website are not necessarily provided by any market or exchange, but may be provided by market makers, and so prices may not be accurate and may differ from the actual price at any given market, meaning prices are indicative and not appropriate for trading purposes. Fusion Media and any provider of the data contained in this website will not accept liability for any loss or damage as a result of your trading, or your reliance on the information contained within this website.
It is prohibited to use, store, reproduce, display, modify, transmit or distribute the data contained in this website without the explicit prior written permission of Fusion Media and/or the data provider. All intellectual property rights are reserved by the providers and/or the exchange providing the data contained in this website.
Fusion Media may be compensated by the advertisers that appear on the website, based on your interaction with the advertisements or advertisers.