Indexes Mixed As Breadth Weakens Further
Guy S. Ortmann, CMT | Nov 22, 2021 09:11AM ET
Some Data Now Suggesting A Pause/Bounce Near-Term
The major equity indexes closed mostly lower Friday with negative internals on the NYSE while the NASDAQ’s were mixed. Most closed near their lows of the session.
The index charts saw a mix of bullish and bearish technical events while cumulative market breadth, that has been an important concern for us, weakened further. However, some of the data is starting to suggest the potential for a pause or near-term bounce for equities. Should that transpire, it would be extremely important, in our opinion, to see some notable improvement in market breadth for us to consider said pause/bounce could be sustainable.
As of this writing, we remain near-term “neutral” in our macro-outlook for equities as the charts and market breadth have yet to offer encouragement while some of the data suggest an easing of recent negative pressure.
On the charts, the major equity indexes closed mostly lower Friday with negative internals on the NYSE as the NASDAQ saw negative breadth but slightly positive up/down volume. Most closed near their lows of the session.
- However, both the COMPQX and NDX posted new closing highs.
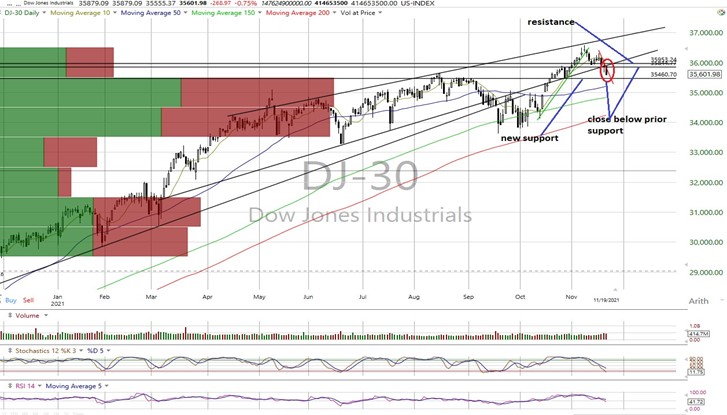
- On the other hand, the DJI closed below support that altered its near-term trend to negative from neutral.
- As such, the chart trends remain mixed with the COMPQX, NDX, and VALUA positive, the DJI and RTY negative and the rest neutral.
- As we have been stressing in our recent comments, cumulative market breadth has been weak and weakened further Friday. Cumulative breadth remains negative on the All Exchange, NYSE and NASDAQ while the All Exchange joined the NASDAQ in trading below their 50 DMAs. We are of the opinion some notable improvement in market breadth would be required to feel more sanguine regarding the macro-outlook.
- No stochastic signals were generated.
The data finds the McClellan 1-Day OB/OS Oscillators moving deeper into oversold territory and implying some potential for an oversold bounce or pause in weakness for the near-term (All Exchange: -74.41 NYSE: -79.77 NASDAQ: -69.54).
- Also offering a little hope was the detrended Rydex Ratio (contrarian indicator) measuring the action of the leveraged ETF traders dipping to 1.15 but remains inside bearish territory. However, they are lightening up on their leveraged long exposure.
- As well, the Open Insider Buy/Sell Ratio lifted to 39.1 as insiders improved their buying appetite but remains neutral. Thus, the Rydex/OIBS dynamic moved in a more encouraging direction.
- Last week’s contrarian AAII Bear/Bull Ratio (0.65) remained neutral as did the Investors Intelligence Bear/Bull Ratio (22.3/56.5) (contrary indicator).
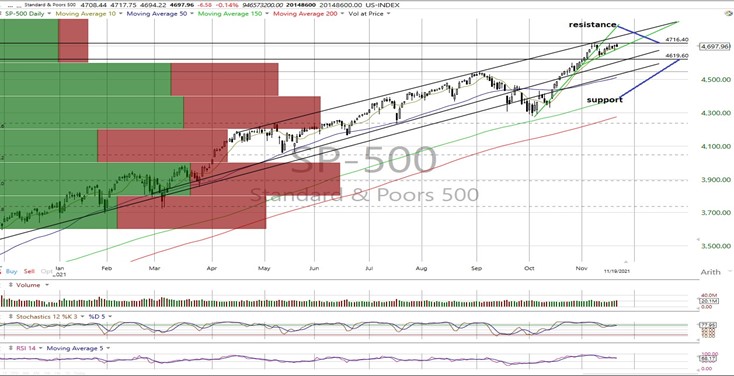
- Valuation finds the forward 12-month consensus earnings estimate from Bloomberg lifting to $2114.15 for the SPX. As such, the SPX forward multiple is 21.9 with the “rule of 20” finding fair value at approximately 18.5.
- The SPX forward earnings yield is 4.56%.
- The 10-year Treasury yield closed at 1.54% and below support. We view resistance at 1.59% and new support at 1.5%.
In conclusion, while the data is suggesting a bounce, we need to see some real improvement in market breadth to warrant a change in our near-term macro-outlook for equites from “neutral”.
SPX: 4,620/4,717A DJI: 35,460/35,953 COMPQX: 15,598/NA NDX: 16,130/NA
DJT: 16,000/16,915 MID: 2,872/2,907 RTY: 2,320/2,375 VALUA: 9,937/10,151
All charts courtesy of Worden
Trading in financial instruments and/or cryptocurrencies involves high risks including the risk of losing some, or all, of your investment amount, and may not be suitable for all investors. Prices of cryptocurrencies are extremely volatile and may be affected by external factors such as financial, regulatory or political events. Trading on margin increases the financial risks.
Before deciding to trade in financial instrument or cryptocurrencies you should be fully informed of the risks and costs associated with trading the financial markets, carefully consider your investment objectives, level of experience, and risk appetite, and seek professional advice where needed.
Fusion Media would like to remind you that the data contained in this website is not necessarily real-time nor accurate. The data and prices on the website are not necessarily provided by any market or exchange, but may be provided by market makers, and so prices may not be accurate and may differ from the actual price at any given market, meaning prices are indicative and not appropriate for trading purposes. Fusion Media and any provider of the data contained in this website will not accept liability for any loss or damage as a result of your trading, or your reliance on the information contained within this website.
It is prohibited to use, store, reproduce, display, modify, transmit or distribute the data contained in this website without the explicit prior written permission of Fusion Media and/or the data provider. All intellectual property rights are reserved by the providers and/or the exchange providing the data contained in this website.
Fusion Media may be compensated by the advertisers that appear on the website, based on your interaction with the advertisements or advertisers.