Index Charts Flash Caution Signals: Excess Of Bullish Expectations
Guy S. Ortmann, CMT | May 11, 2021 09:42AM ET
Sentiment Data Still Suggests Too Many Bulls Currently All the major equity indexes closed lower Monday with negative internals on the NYSE and NASDAQ as trading volumes rose from the prior session. The charts saw some 50 DMAs violated to the downside as well as some bearish “gravestone doji” signals appearing. The very negative futures this morning appear to be validating the doji signals. Meanwhile, while the McClellan OB/OS Oscillators are neutral, the psychological data continues to suggest an excess of bullish expectations on the part of investors persists while insiders have yet to show any significant interest in buying their stocks at current levels. So, while the proverbial horse may have left the barn, the new chart signals combined with the sentiment data suggest we shift our near-term macro-outlook for equities from “neutral/positive” to “neutral.” In our opinion, today’s close may well be an important factor regarding the very near term. If no rally near the close appears, it would, in our view, be another negative. On the charts, all the indexes closed lower yesterday with negative internals and higher trading volume on both the NYSE and NASDAQ. Chart weakness was seen on the COMPQX and NDX as both closed below their 50 DMAs and the COMPQX returned to a near-term downtrend. As noted above, the DJI and DJT that had been leading the markets formed “gravestone doji” patterns that occurred after a long uptrend. The pattern formation is one where a stock or index opens, trades nicely higher intraday but then closes back down at or very near the open price. It suggests an exhaustion of buyers. The VALUA also flashed a bearish stochastic crossover signal. Near term trends are negative on the COMPQX, NDX and RTY with the rest positive, but likely to be violated today. Cumulative breadth remains negative on the All Exchange and NASDAQ, but positive on the NYSE. On the data, the McClellan 1-Day OB/OS oscillators remain neutral (All Exchange: 28.67 NYSE: -7.46 NASDAQ: -46.87). Sentiment indicators still suggest an excess of bulls as the wall of worry needs repair. The Rydex Ratio (contrarian indicator) measuring the action of the leveraged ETF traders, is still in bearish territory at 1.2. This week’s Investors Intelligence Bear/Bull Ratio (contrary indicator) saw a rise in bullish sentiment at 16.8/60.4 as the AAII bear/bull ratio at 23.1/46.3 both remain in bearish territory. The Open Insider Buy/Sell Ratio is bearish as well at 24.0 as insiders continue to sit on the sidelines. Valuation still appears extended with the forward 12-month consensus earnings estimate from Bloomberg rising to $188.97. This leaves the SPX forward multiple at 22.2. The “rule of 20” still finds fair value at 18.4. The valuation spread has been consistently wide over the past several months while the forward estimates have risen rather consistently. The SPX forward earnings yield dipped to 4.51%. The 10-year Treasury yield closed at 1.6%. We continue to view 1.55% as support with 1.63% as resistance. In conclusion, as discussed above, the charts and data now suggest caution has become more advisable. S&P 500: 4,1940/NA DJI: 34,037/NA COMPQX: 13,320/13,712NDX: 13,316/13,755 DJT: 15,270/NA MID: 2,702/NARTY: 2,250/2,300 VALUA: 9,385/NA
S&P 500
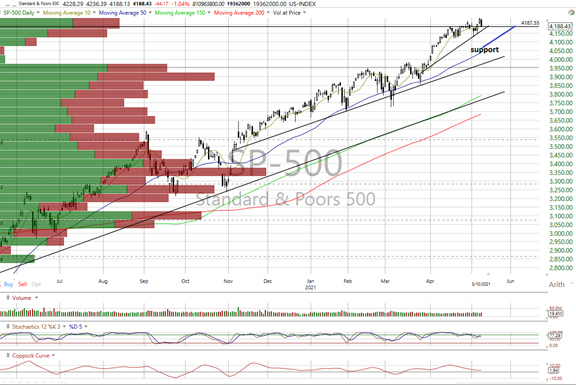
source: Worden
Dow Jones Industrial Average
source: Worden
NASDAQ Composite
source: Worden
NASDAQ 100
source: Worden
Dow Jones Transports
source: Worden
S&P Midcap 400
source: Worden
Russell Small Caps
source: Worden
original post
Trading in financial instruments and/or cryptocurrencies involves high risks including the risk of losing some, or all, of your investment amount, and may not be suitable for all investors. Prices of cryptocurrencies are extremely volatile and may be affected by external factors such as financial, regulatory or political events. Trading on margin increases the financial risks.
Before deciding to trade in financial instrument or cryptocurrencies you should be fully informed of the risks and costs associated with trading the financial markets, carefully consider your investment objectives, level of experience, and risk appetite, and seek professional advice where needed.
Fusion Media would like to remind you that the data contained in this website is not necessarily real-time nor accurate. The data and prices on the website are not necessarily provided by any market or exchange, but may be provided by market makers, and so prices may not be accurate and may differ from the actual price at any given market, meaning prices are indicative and not appropriate for trading purposes. Fusion Media and any provider of the data contained in this website will not accept liability for any loss or damage as a result of your trading, or your reliance on the information contained within this website.
It is prohibited to use, store, reproduce, display, modify, transmit or distribute the data contained in this website without the explicit prior written permission of Fusion Media and/or the data provider. All intellectual property rights are reserved by the providers and/or the exchange providing the data contained in this website.
Fusion Media may be compensated by the advertisers that appear on the website, based on your interaction with the advertisements or advertisers.