In Depth Look At The Gold Breakout. Can Silver Follow?
Jason Sen | May 16, 2019 12:17AM ET
Gold appears to have been trading in a huge sideways trend over the past 3 years after the price bottomed right at the end of 2015.
More recently we saw a strong recovery from an August 2018 low of $1160 with prices peaking at $1346 six months later in February of this year. We seem to have experienced a healthy correction to the downside, over the past 2-3 months as prices dipped to $1265, just below the 500 day moving average support at $1275.
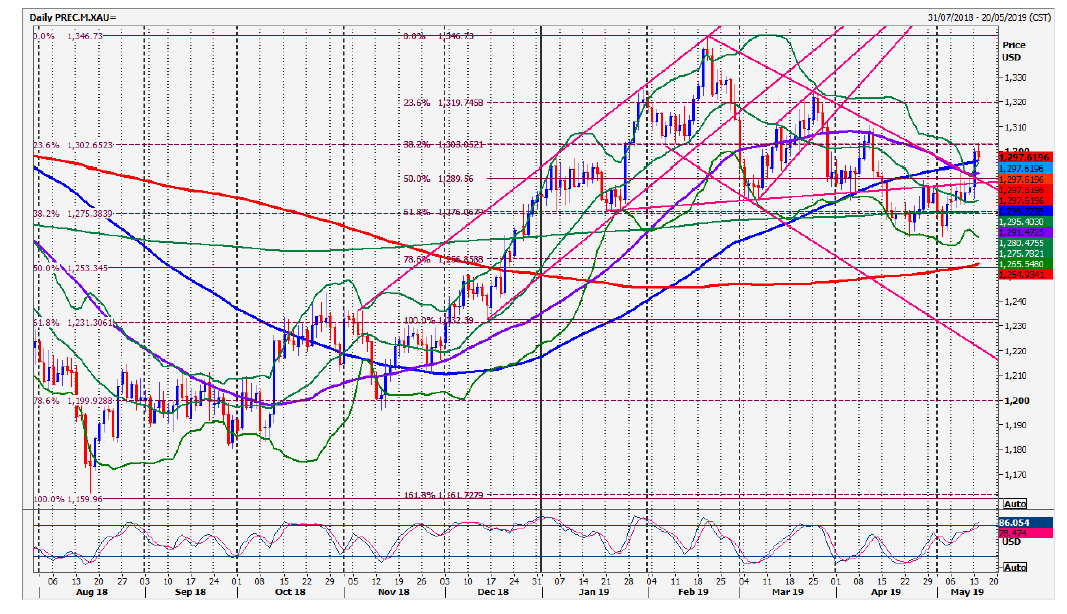
An excellent recovery this month saw Gold initially holding the 2-month trend line resistance at around $1290 at the end of last week. However, yesterday’s bullish breakout acts as a buy signal, as we beat the blue 100 day moving average at $1296 for further bullish confirmation.
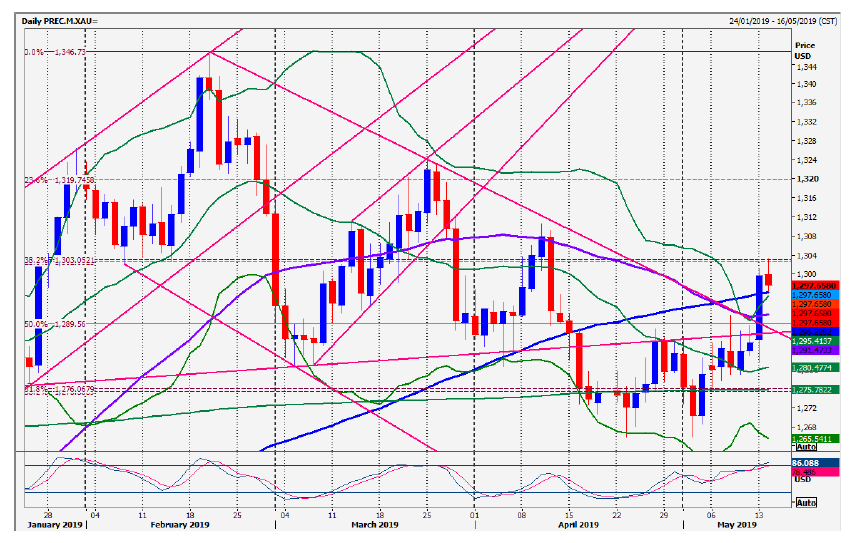
Yesterday we hit and held minor Fibonacci resistance at $1303 as you can see in the daily chart above, but the downside should be limited after the medium term buy signal. We look for first support at $1296/95. If we unexpectedly continue lower look for an excellent buying opportunity at $1290/88.
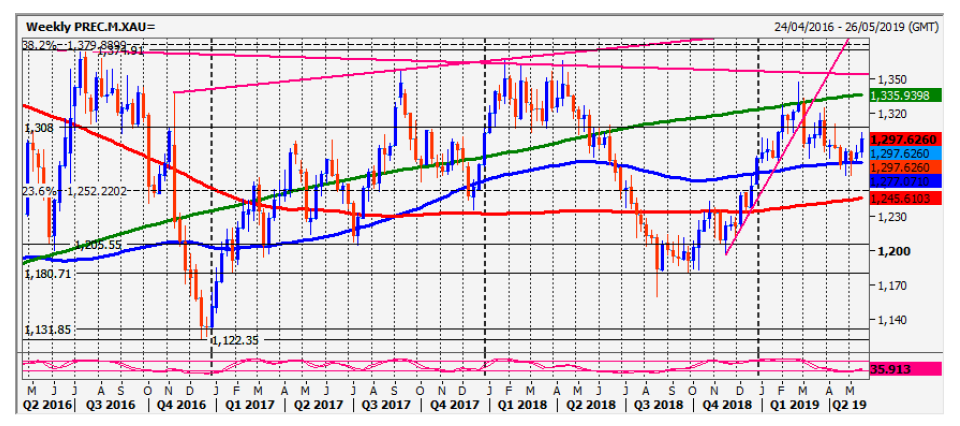
Bulls need a break above minor resistance at $1303 (should happen eventually) to target 1306, minor resistance at $1310 then $1317/19. Once through the March peak of $1324 we look for $1330/1333, $1336, $1341/42 and a retest of resistance at the recovery high at $1346. Silver has been in a bear trend since July 2016. A good recovery at the start of this year saw prices climb to strong resistance at the blue 100 and red 200 week moving averages and descending trend line dating back to September 2017, as you can see in the weekly chart below.
Not surprisingly we saw the bears retake control at this stage but prices have held the more minor September 2018 trend line support when tested over the past 3-4 weeks, in severely oversold conditions.
Bulls must tackle key resistance at $14.88/92 from the 1-month descending trend line and the red 200 day moving average plus the short term 23.6% Fibonacci level.
A break above $14.97 is a buy signal, therefore. Above the purple 55 day moving average and upper Bollinger band® at $15.10 confirms further gains to $15.17/20 and $15.30 first resistance at $15.35/38.
Holding below the first support at 1475 retests the May low of 1458/52. A break lower tests 2-month descending trend line support at $14.40. This is the last line of defense for bulls.
Trading in financial instruments and/or cryptocurrencies involves high risks including the risk of losing some, or all, of your investment amount, and may not be suitable for all investors. Prices of cryptocurrencies are extremely volatile and may be affected by external factors such as financial, regulatory or political events. Trading on margin increases the financial risks.
Before deciding to trade in financial instrument or cryptocurrencies you should be fully informed of the risks and costs associated with trading the financial markets, carefully consider your investment objectives, level of experience, and risk appetite, and seek professional advice where needed.
Fusion Media would like to remind you that the data contained in this website is not necessarily real-time nor accurate. The data and prices on the website are not necessarily provided by any market or exchange, but may be provided by market makers, and so prices may not be accurate and may differ from the actual price at any given market, meaning prices are indicative and not appropriate for trading purposes. Fusion Media and any provider of the data contained in this website will not accept liability for any loss or damage as a result of your trading, or your reliance on the information contained within this website.
It is prohibited to use, store, reproduce, display, modify, transmit or distribute the data contained in this website without the explicit prior written permission of Fusion Media and/or the data provider. All intellectual property rights are reserved by the providers and/or the exchange providing the data contained in this website.
Fusion Media may be compensated by the advertisers that appear on the website, based on your interaction with the advertisements or advertisers.