Implied Volatility Crush In AAPL Can Lead To Profits
J.W. Jones | Nov 21, 2012 11:40AM ET
The recent massive sell off in (AAPL ) stock has presented some interesting opportunities for low risk trades. For long time readers of this column, you may recognize that my portfolio usually contains an AAPL position.
Why? I cannot overemphasize the importance of trading liquid instruments, and in the current world, very few underlying issues have options with the degree of liquidity routinely available in a wide spectrum of strike prices and expiration dates.
What is the big deal about liquidity? When markets trade in an orderly fashion it is usually possible to negotiate a reasonable price for all but the most illiquid underlying. However, when blood is running in the street, market makers will routinely widen bid / ask spreads and attempt to extract well more than a pound of flesh. It is only in the most liquid series that any hope of a reasonable exit in these times can be found.
Ok, sermon is over; I like AAPL! For those who have not looked at the option chain for AAPL since last Thursday, I want to call attention to another new aspect of the tremendous flexibility that exists in this name. Entirely new sets of weekly options are now trading, not just those for the next upcoming Friday expiration.
This means as I type on Tuesday morning, I can trade liquid options for calendar year 2012 that expire in 3, 10, 17, 24, or 31 days. That is a lot of choices and will allow us to exploit a never before level of granularity in constructing our trades.
The trade I would like to discuss is a high probability of success trade that is based on the expansion of implied volatility in AAPL as a result of the brutal sell off that has brought the stock from its recent highs a bit over $700 to its current price of $565 despite yesterday’s neck snapping $30 / share rally.
As regular readers know, the first characteristic I evaluate in seeking a high probability trade is that of the current status of implied volatility. AAPL is one of a handful of stocks that have listed values for implied volatility.
As an aside, the history and current status of implied volatility is discernible for all stocks having listed options, but may require access to a broker database or one of several fee based sites.
The current status of implied volatility for AAPL, symbol VXAPL, is shown below:
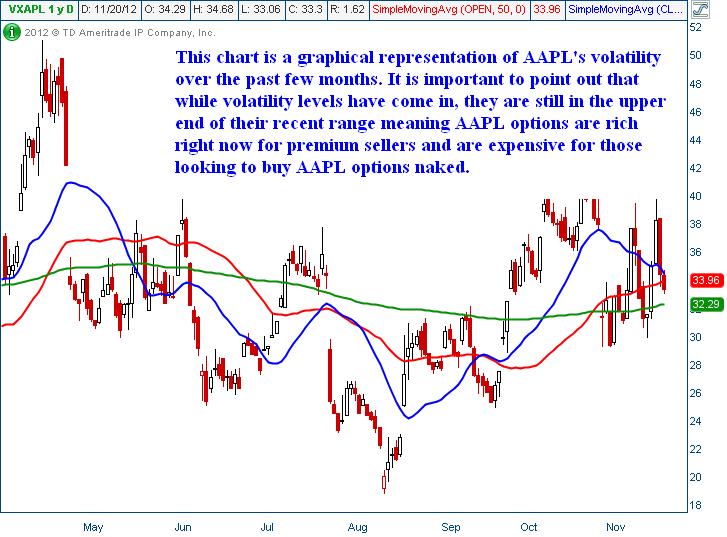
As is obvious, the value has “come in” recently but still remains in the upper half of its recent range, particularly when excluding the characteristic spike in volatility preceding the recent release of third quarter earnings in October. Since currently elevated levels of implied volatility indicate that options are rich on an historic basis, it seems logical to consider a trade that benefits from selling these rich assets.
The purest way to sell option premium in a non directional based trade is to sell a naked strangle. A naked strangle is a position established by selling both a naked put and a naked call. The trade is typically constructed in far out-of-the-money strikes, typically with a delta valued at an absolute value of 5 to 10, and having duration of 25 to 35 days.
I have illustrated below, the P&L curve for a 10 lot naked strangle for December monthly options. The put and call are sold at the $475 Put and the $630 Call strikes. The trade has an 87% probability of profitability and yields 9% for a 32 day holding period.
A word of explanation of the manner in which the probabilities are derived is in order. One of the helpful practical characteristics of the options “Greeks” is the fact that the delta of an option is closely correlated to its probability of being in-the-money at expiration.
In the case of the options we are selling, the puts have a delta of -6 and the calls have a delta of 10. This means the puts have a probability of 94% of being out-of–the-money at expiration and the calls have a probability of 90%.
The probability of both contracts being out of the money is therefore 0.9*0.94= .84 or 84%. The credit we initially received serves to broaden the profitability zone a bit, resulting in the stated 87% probability of profit.
This is a very capital intensive trade with unlimited risk. In the illustrated size of a 10 lot trade, the buying power reduction required in a regulation T account is around $56,000. On this basis, the trade yields 9% at expiration.
For those with risk based margin, more commonly known as Portfolio Margin, the margin is a bit less than half that amount. This dramatic reduction in margin requirements results in a yield in excess of 18%.
These trade constructions illustrate the pure return and probabilities of success for a premium selling approach and illustrate the logical thought process of pursuing such a strategy. An important caveat is that these unlimited risk trades such as illustrated must be taken in small size relative to the total portfolio to reduce risk and allow for adjustments when price does not behave.
While these structures are not common and require a certain degree of capital and professional understanding, the probabilities and potential returns are such that small positions can result in large profitability outcomes on a monthly basis.
Trading in financial instruments and/or cryptocurrencies involves high risks including the risk of losing some, or all, of your investment amount, and may not be suitable for all investors. Prices of cryptocurrencies are extremely volatile and may be affected by external factors such as financial, regulatory or political events. Trading on margin increases the financial risks.
Before deciding to trade in financial instrument or cryptocurrencies you should be fully informed of the risks and costs associated with trading the financial markets, carefully consider your investment objectives, level of experience, and risk appetite, and seek professional advice where needed.
Fusion Media would like to remind you that the data contained in this website is not necessarily real-time nor accurate. The data and prices on the website are not necessarily provided by any market or exchange, but may be provided by market makers, and so prices may not be accurate and may differ from the actual price at any given market, meaning prices are indicative and not appropriate for trading purposes. Fusion Media and any provider of the data contained in this website will not accept liability for any loss or damage as a result of your trading, or your reliance on the information contained within this website.
It is prohibited to use, store, reproduce, display, modify, transmit or distribute the data contained in this website without the explicit prior written permission of Fusion Media and/or the data provider. All intellectual property rights are reserved by the providers and/or the exchange providing the data contained in this website.
Fusion Media may be compensated by the advertisers that appear on the website, based on your interaction with the advertisements or advertisers.