How Will We Know When the Rally is Over? Watch Junk Bonds for Answers
Michele Schneider | Feb 12, 2024 02:12AM ET
I first became interested in junk bonds right before COVID-19 hit in January 2020.
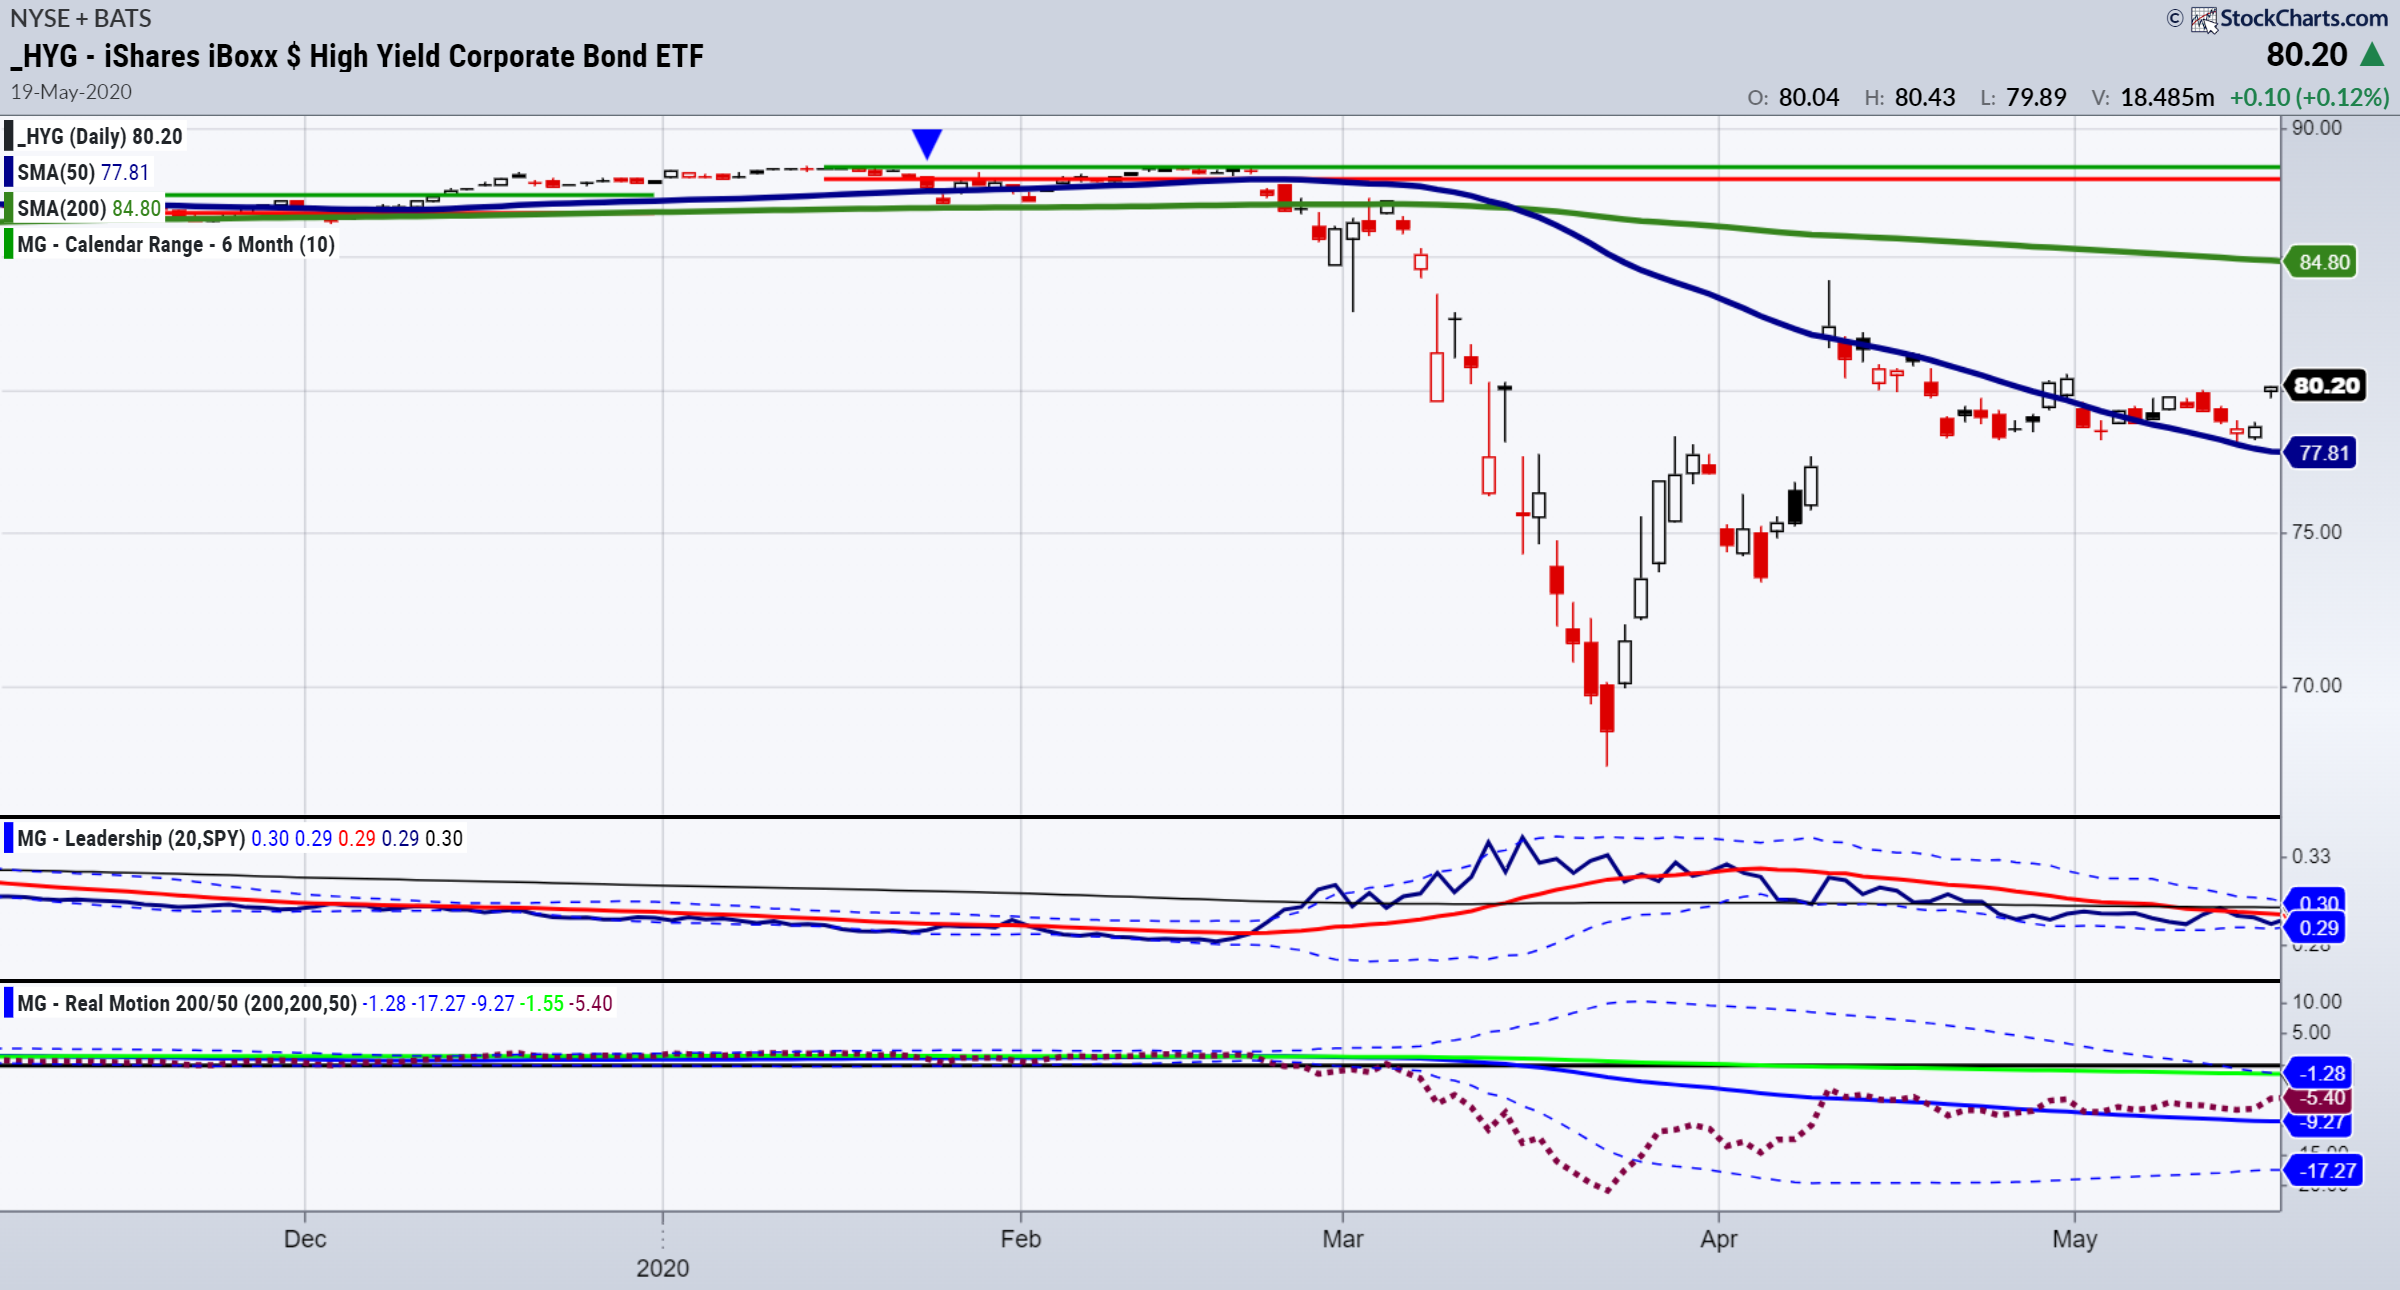
Note the price at the time of HYG was around 88.50.
Since HYG represents high yield/high debt companies that pay well in a risk on environment, what struck me in early 2020 was that HYG could not clear the horizontal green line or the top of the January 6-month calendar range high.
Then, at the end of January, or where the blue arrow is pointing on the chart, HYG broke the January 6-month calendar range low and the 50-DMA (blue) but held the 200-DMA (also in green).
In February, HYG tried a few more times to clear the January highs and could not.
When I saw HYG break below the 200-DMA at the end of February 2020, I started to pay attention.
As you can see, in March and with the news of Covid, mostly everything got hit hard.
That spectacular drop in HYG happened ahead of the news and ahead of the rest of the market’s drop.
Risk-off was glaring.
Once April began, HYG cleared back over the 50-DMA (blue) signaling to us the coast was clear to get back into equities.
What should we watch for now?
Present Time
We all know how spectacular this rally has been to date.
Not only do we see new highs nearly every day in QQQ DIA and SPY, BUT the AI craze ALSO keeps elevating everyone’s mood and risk appetite.
Small caps are trying hard to clear back over 200 (IWM).
The long bonds are showing that rates have peaked but not necessarily going down anytime soon.
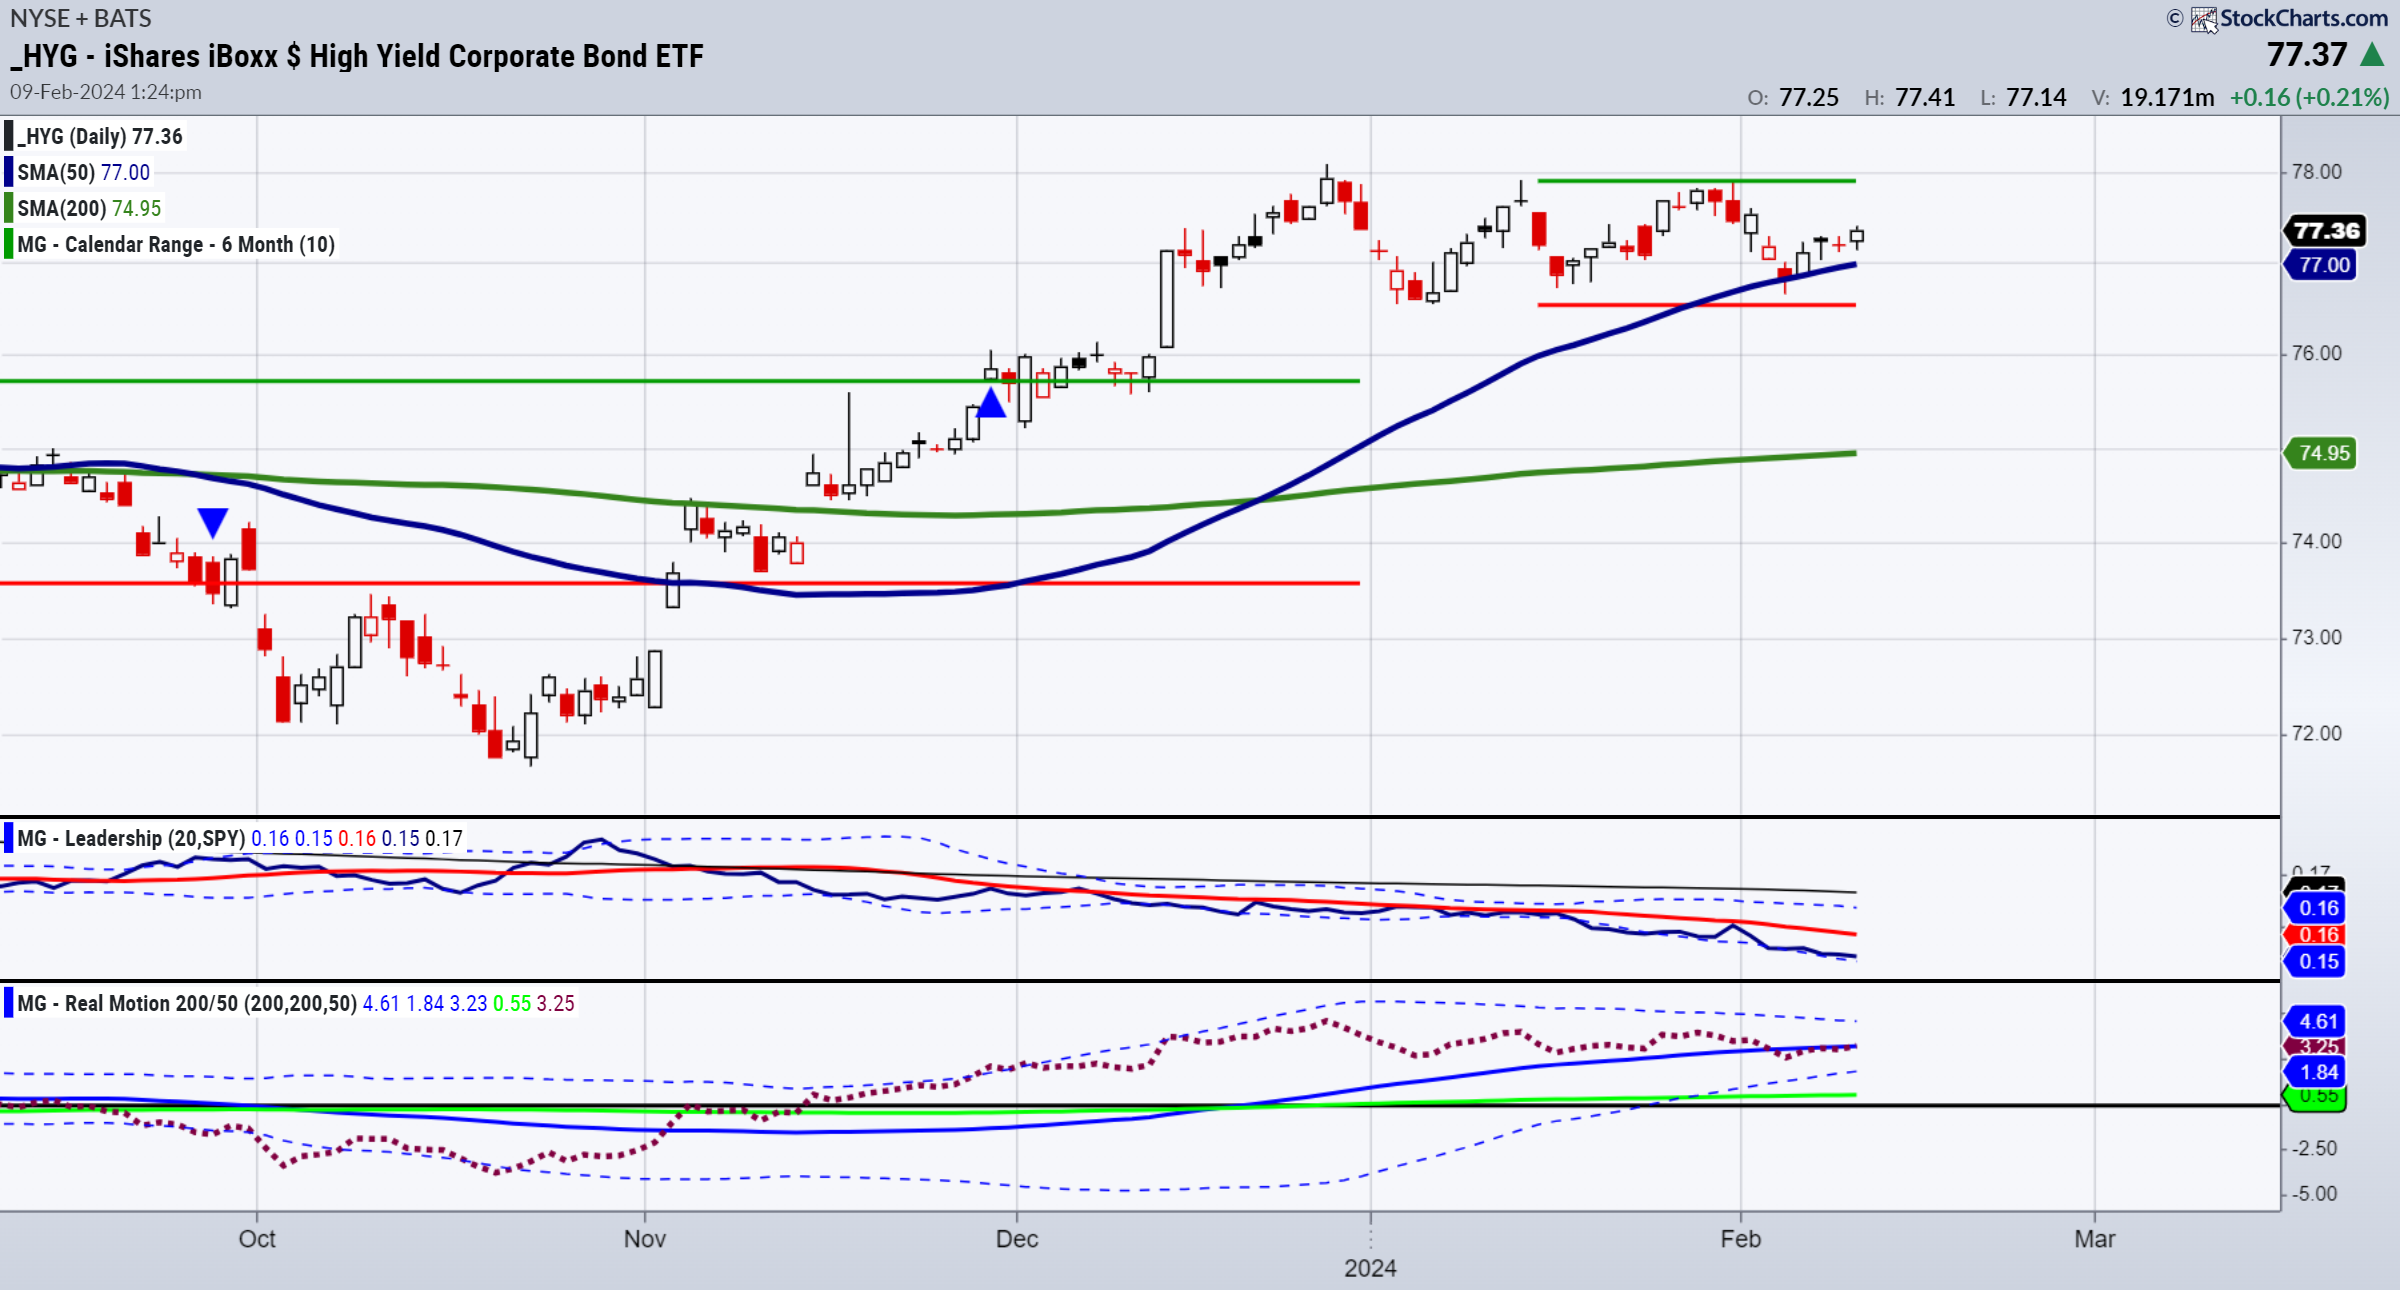
So, I have once again four years later, become extremely focused on how HYG is doing and will do.
Like early 2020, HYG has yet to take out its January 6-month calendar range high, while NASDAQ SPY and DIA have.
As we are almost halfway through February, HYG is acting stronger than it did in February 2020.
However, there are some warning signs to watch.
- The price is in the middle of the January range which could mean we see HYG catch up to QQQ and risk remains on. But it could also mean HYG breaks the January lows.
- HYG sits on the 50-DMA but has yet to leave a lot of distance between price and the moving average.
- HYG well underperforms SPY in the Leadership indicator. This means that the money flow is not necessarily going towards a sustained risk-on environment. Rather, it illustrates the concentration of how few stocks are participating in this rally, while junk bonds traders are more cautious.
- The Real Motion or momentum indicator is in a bit of a bearish divergence to price. With momentum under the 50-DMA, any further weakness in price could see momentum decline more sharply.
The bottom line is that we do not see the glaring warning in HYG at this time as we did in 2020.
Nonetheless, we see a bigger reason to watch junk bonds just as we did in 2020.
This type of underperformance, if leads to a break of the January calendar range or a phase change to caution, will give us a heads-up to also be more cautious at the very least.
Then, we can take it from there.
ETF Summary
- S&P 500 (SPY) 500 now the pivotal point-perhaps we see 510 before we see 490.
- Russell 2000 (IWM) 195 now support and the jan calendar range 201.50 must clear
- Dow (DIA) Week ends with an inside day near ATHs. 385 key support
- Nasdaq (QQQ) 430 support
- Regional banks (KRE) Back to the 45-50 range
- Semiconductors (SMH) Our sister semiconductor superstar. Support 196
- Transportation (IYT) We started last week looking here and it did its job-now, 266 support
- Biotechnology (IBB) 135 pivotal -like this sector but has more to prove
- Retail (XRT) Granny did her job clearing 70. The Jan calendar range high at 73 now must clear
Trading in financial instruments and/or cryptocurrencies involves high risks including the risk of losing some, or all, of your investment amount, and may not be suitable for all investors. Prices of cryptocurrencies are extremely volatile and may be affected by external factors such as financial, regulatory or political events. Trading on margin increases the financial risks.
Before deciding to trade in financial instrument or cryptocurrencies you should be fully informed of the risks and costs associated with trading the financial markets, carefully consider your investment objectives, level of experience, and risk appetite, and seek professional advice where needed.
Fusion Media would like to remind you that the data contained in this website is not necessarily real-time nor accurate. The data and prices on the website are not necessarily provided by any market or exchange, but may be provided by market makers, and so prices may not be accurate and may differ from the actual price at any given market, meaning prices are indicative and not appropriate for trading purposes. Fusion Media and any provider of the data contained in this website will not accept liability for any loss or damage as a result of your trading, or your reliance on the information contained within this website.
It is prohibited to use, store, reproduce, display, modify, transmit or distribute the data contained in this website without the explicit prior written permission of Fusion Media and/or the data provider. All intellectual property rights are reserved by the providers and/or the exchange providing the data contained in this website.
Fusion Media may be compensated by the advertisers that appear on the website, based on your interaction with the advertisements or advertisers.