How To Spot The End Of An Excess Phase – Part II
Chris Vermeulen | Nov 29, 2020 02:40AM ET
In Part I of this research article, my research team and I highlighted the five unique components of an Excess Phase peak and breakdown process. We are sharing this data with you because we believe the US stock market has already meandered 2.5 years past the end of a US Stock Market Appreciation phase and is well into an Excess Phase Peaking process. This becomes very important for traders because risks are much higher in these late Excess Phase stages because volatility is usually 4x to 6x higher than previous phases. Additionally, psychologically, many traders want the rally to continue and deeply believe the end of this phase is “just a pullback in a bigger trend”. This can be very dangerous as traders sometimes continue to buy into deeper price corrections – leveraging their accounts to the hilt thinking “they are going to make a killing when the rally resumes”.
EXPLORING PAST EXCESS PHASE PEAK/BREAKDOWN EVENTS
Excess Phases and Blow-Off Peaks/Bottoms can become very addictive for certain people – especially those that have gotten into the trend before the Excess Phase began. These people are often “die-hard” believers that the trend will never stop rallying and can sometimes leverage themselves into very dangerous positions.
If you recall from the first part of this research article, there are five phases to the Excess Phase price decline and we believe each of these five phases is fairly common for all excess phase breakdowns:
- The Excess Phase Rally must push price levels to new highs.
- A breakdown in price from the Excess Phase Peak sets up a FLAG/Pennant recovery phase. This represents the first attempt at a recovery that eventually fails
- A breakdown in price from the FLAG/Pennant price recovery phase creates the real first opportunity for short traders or those that executed timely Put options. This represents the first real downward price trend after the FLAG setup.
- Phase 3 sets up the Intermediate-term support level. This becomes the last line of defense for price – an intermediate-term price floor. This phase can take quite a while to complete as traders often still believe a new rally will resume – thus, this support level often has quite a bit of momentum to breakdown before it eventually fails.
- The final breakdown of price below the Phase 4 support level usually begins a much deeper sell-off. This is usually when other factors in the markets have finally resulted in the realization that the excess phase is over.
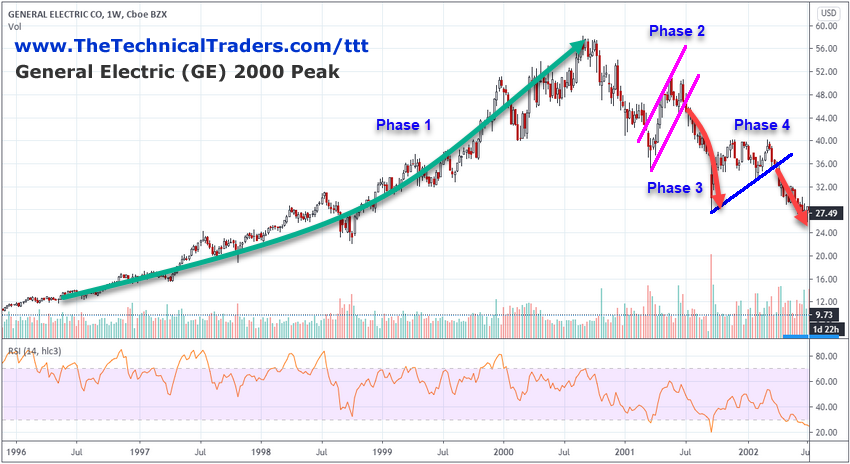
The following Weekly General Electric (NYSE:GE) chart from 2000 clearly illustrates the five phases of the Excess Breakdown event. Notice how deep the initial breakdown in price was from the peak in late 2000 to the initial FLAG formation (Phase 2). Additionally, pay attention to how deep price actually fell throughout the peak to Phase 4 end. From a peak price level near $58 to a low price level near $36 – this represents 38% price decline. Phases 3 & 4 represent the last defense of price near a support level before continued selling drives price levels lower. GE price levels eventually fell to levels near $20.50 in 2003 from these peaks. An almost identical Excess Phase peak setup in 2007, which resulted in a breakdown in price from $40.36 to $5.50 – representing a whopping 86% decline.
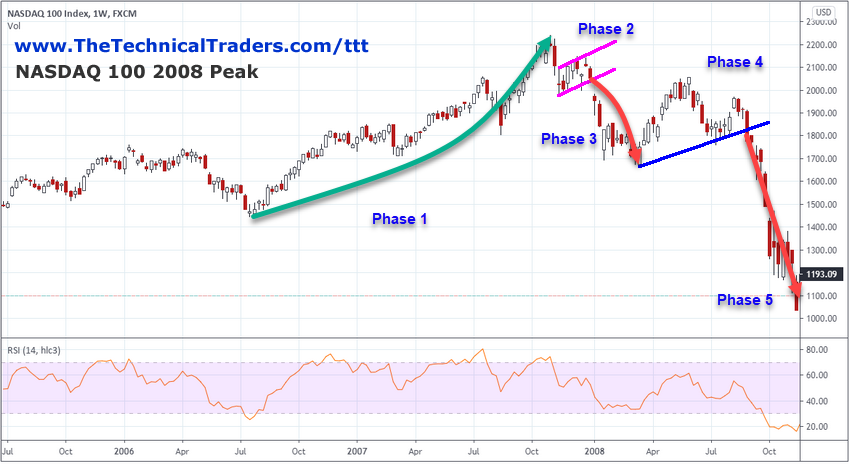
This next example of the NASDAQ peak in 2007 shows a similar, yet tighter, Excess Phase breakdown event. Notice that all five components are clearly visible in this example as well. Initially, the Excess Phase rally reached a new price peak, then a very quick breakdown in price setup the Phase 2 FLAG setup. A large GAP breakdown ended the FLAG setup and prompted the Phase 3 price decline. This decline set up the Phase 4 extended support phase which acts as the “last line of defense” for price. Eventually, that support level was breached and the NASDAQ price levels began to decline very rapidly.
After the January 2018 collapse in price, we published articles suggesting the markets would recover fairly quickly and push to new highs, accurately predicting the recovery after the October 2018 collapse. In August 2019, we issued a “Super-Cycle warning” suggesting everyone take immediate action to protect assets/capital. On February 21, 2020, we issued our “Black Swan Warning” suggesting everyone take immediate action to protect assets/capital related to the COVID-19/Global Markets event. Recently, on September 12, 2020, we issued our “Grey Swan Warning” suggesting that an Excess Phase peak was very near and that we may begin to see extreme volatility and downside price trends.
If our research is correct, we believe we are very close to an end-of-year Excess Phase “Blow-off” peak in the US stock markets and may begin to set up these five phases of the Excess Phase Breakdown.
Trading in financial instruments and/or cryptocurrencies involves high risks including the risk of losing some, or all, of your investment amount, and may not be suitable for all investors. Prices of cryptocurrencies are extremely volatile and may be affected by external factors such as financial, regulatory or political events. Trading on margin increases the financial risks.
Before deciding to trade in financial instrument or cryptocurrencies you should be fully informed of the risks and costs associated with trading the financial markets, carefully consider your investment objectives, level of experience, and risk appetite, and seek professional advice where needed.
Fusion Media would like to remind you that the data contained in this website is not necessarily real-time nor accurate. The data and prices on the website are not necessarily provided by any market or exchange, but may be provided by market makers, and so prices may not be accurate and may differ from the actual price at any given market, meaning prices are indicative and not appropriate for trading purposes. Fusion Media and any provider of the data contained in this website will not accept liability for any loss or damage as a result of your trading, or your reliance on the information contained within this website.
It is prohibited to use, store, reproduce, display, modify, transmit or distribute the data contained in this website without the explicit prior written permission of Fusion Media and/or the data provider. All intellectual property rights are reserved by the providers and/or the exchange providing the data contained in this website.
Fusion Media may be compensated by the advertisers that appear on the website, based on your interaction with the advertisements or advertisers.