How To Create A Watchlist
Deron Wagner | Sep 10, 2019 03:22AM ET
Having an updated watchlist is one of the most important elements of profitable trading. A well manicured watchlist will eventually produce actionable setups while keeping traders disciplined and true to their own system.
How do we create a solid watchlist? Scan, scan and scan some more. Consistent scanning is key. Whether it’s daily or weekly, or a combination of both. For those who do not have the time to scan but are serious about trading, we suggest locating a trusted paid service. Either way, an updated watchlist is a must.
Since scanning is so important, we have a simple system in place to identify what setups should be flagged for further monitoring. Knowing what to look for helps keep our lists manageable.
In general, we are looking for stocks that have been in base mode for 4-5 weeks or more within 10-40% of recent highs. When going through several hundred charts, it’s important to focus on stocks that are showing bullish momentum on the daily chart and ignore those that are in deep correction mode.
In our system, a stock is in deep correction mode when it is 20% or more off highs and has formed a series of lower highs and lower lows below the 20-day and/or 50-day moving averages on a daily chart. We avoid these stocks until they show signs of bullish momentum, such as a break of the downtrend line or higher lows on the daily chart. Stocks that have a high relative strength rating from IBD and correct 15% or less off highs should not be ignored and do not count as those in deep correction mode (even if printing lower highs and lower lows). Most stocks that are within 15% of highs with a 20-day EMA above the 50-day MA should be flagged and on a watchlist.
What We Look For
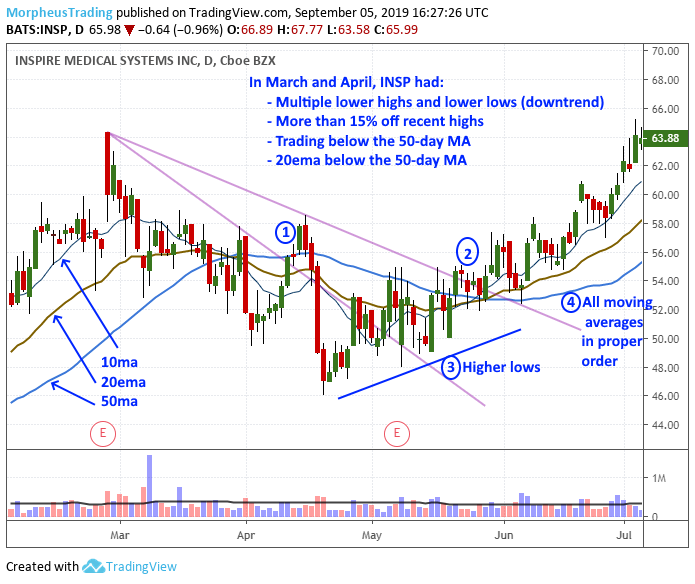
Let’s walk through this process on the daily chart of $INSP below.
Inspire Medical Systems Inc (NYSE:INSP) stalled above $60 and then broke down below the 20-day and 50-day moving averages in March and April. If looking at the chart in early April, it is not something we’d want to flag even after it breaks the downtrend line at (1) as the break fails to hold and leads to new lows. Looking at the daily chart in May, it would probably not make our list until producing higher lows around (3), which is still questionable.
Momentum really begins to pick up at (2), where the price clears the 50-day MA and holds while breaking the downtrend line with several higher lows already in place. The 20-day EMA also crosses above the 50-day MA, so a lot of bullish signs converging. This is when $INSP should be on a watchlist, as it builds out the right side of its base.
The chart of Cyberark Software Ltd (NASDAQ:CYBR) below is a bit different, as the selloff is more of a quick shakeout than $INSP’s downtrending action over several weeks. There is a downtrend line break early, but the line is way too steep. Also, the pullback after the bounce stalls and fails to hold the 20 and 50-day MAs, nearly giving back the entire advance. A few week later, $CYBR clears the downtrend line on volume and is in play and should be on a watchlist. We entered around $78 in our nightly newsletter, The Wagner Daily .
Galapagos NV ADR (NASDAQ:GLPG) stalled at $74 and was in correction mode all through November. Momentum doesn’t come in until a mid-December downtrend line break. When the price recovers above the 50-day MA and the 20-day EMA crosses above the 50-day MA, that is when it should be on a watchlist.
After scanning through several hundred charts we usually end up flagging stocks that may be ready to move higher within in a few days or a few weeks. From this main list we create two sub lists. One list will have all setups that are close to producing ideal buy points but may need a bit more time to develop. The other list should be reserved for actionable setups only, where the odds favor the stock moving significantly higher within the next few days. From here, it’s just a matter of consistently updating this watchlists and then executing on the trading end.
Scan. Make a watchlist. Monitor watchlist for entry points. Enter when alerts trigger. Manage trade. Repeat.
Original Post
Trading in financial instruments and/or cryptocurrencies involves high risks including the risk of losing some, or all, of your investment amount, and may not be suitable for all investors. Prices of cryptocurrencies are extremely volatile and may be affected by external factors such as financial, regulatory or political events. Trading on margin increases the financial risks.
Before deciding to trade in financial instrument or cryptocurrencies you should be fully informed of the risks and costs associated with trading the financial markets, carefully consider your investment objectives, level of experience, and risk appetite, and seek professional advice where needed.
Fusion Media would like to remind you that the data contained in this website is not necessarily real-time nor accurate. The data and prices on the website are not necessarily provided by any market or exchange, but may be provided by market makers, and so prices may not be accurate and may differ from the actual price at any given market, meaning prices are indicative and not appropriate for trading purposes. Fusion Media and any provider of the data contained in this website will not accept liability for any loss or damage as a result of your trading, or your reliance on the information contained within this website.
It is prohibited to use, store, reproduce, display, modify, transmit or distribute the data contained in this website without the explicit prior written permission of Fusion Media and/or the data provider. All intellectual property rights are reserved by the providers and/or the exchange providing the data contained in this website.
Fusion Media may be compensated by the advertisers that appear on the website, based on your interaction with the advertisements or advertisers.