How Do Options Experience Time?
Vance Harwood | Oct 07, 2014 01:58AM ET
While doing simulations on volatility and the square root of time I started thinking about how options experience time—is it calendar time, market time, or something in-between? The CBOE’s VIX® calculations use calendar time, a 365 day year, but most option gurus recommend using a 252 day year for volatility calculations—the typical number of trading days per year in the USA markets.
When it comes to option decay most people, including the gurus, believe that option values decay when the markets are closed—a position I believe conflicts with the 252 day approach to annualizing volatility.
The experimental discovery that led to the current theory of option decay occurred in 1825 when the botanist Robert Brown looked through his microscope at pollen grains suspended in water and noticed they were moving in an irregular pattern. He couldn’t explain the motion but later physicists including Albert Einstein showed it was the result of water molecules randomly colliding with the pollen. This effect was named “Brownian Motion” in honor of Mr. Brown.
If you effectively stop time in Mr. Brown’s experiment (e.g., freeze the sample), the pollen will stop moving. Or if you close a casino for a day (probably a better model for the market) the net worth of the associated gamblers stops dropping.
Defenders of the calendar time approach point out there are many activities / events with broadband impact that can move the value of the underliers while the market is closed. Things like extended trading hours, activity in foreign markets, corporate announcements, geopolitical events, and natural disasters.
However it occurs to me that most noteworthy events that happen outside of market hours tend to be bad news. For example, I’m not expecting to see headlines any time soon stating, “ISIS disbands, ‘We realized it was all a terrible misunderstanding’”, or “Harmless landslide reveals huge cache of gold”. This tendency towards negative moves is reflected in the average annual growth rate of off market hours for the last 20 years, -0.37% vs +9.59% for market hours. And bad news tends to make option prices go up…
If option time is still running when the markets are closed I would expect the market’s opening value to be different from the closing value. Below is a quick look at the last 20 years of data:
S&P 500 Returns 1-Jan-1994 through 22-Aug-2014 (5197 market days)
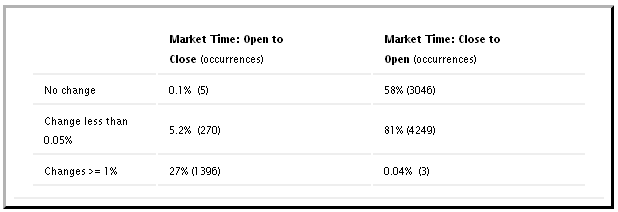
I was surprised how often the market opened at no-change from the previous close (3046 times) and how seldom it has gapped overnight more than +-1% (3 times).
So what?
So far my arm-waving arguments give the edge to market time over calendar time, but really, so what?
Practically there are two things where this makes a difference: the dynamics of option decay and the accuracy of implied volatility calculations on soon to expire options.
Option Decay
Novice options traders are usually disappointed if they try to profit from Commentators explain this phenomena noting that market makers, not wanting to be stuck with Theta losses over the weekend, discount prices, overriding their models before the weekend to move their inventory—just like a fruit vendor would.
I think the market makers are right for the wrong reason. Their computer models are (or at least were) based on calendar day assumptions—which assume option decay during the weekend. By overriding their models they are pricing according to what really happens—no decay when the market is closed.
Annualizing factors
For longer term expectations of volatility it doesn’t matter much which approach you use. For options expiring a month from now the differences in implied volatility are only a few percent between the 365 vs 252 day models. However for shorter expirations the differences can be dramatic.
The chart below compares per minute values between the two annualizing approaches and shows the percentage difference. The calendar based approach is the black line and the green line is the market time. Notice how the difference peaks at Monday open and drops to near agreement at Friday close.
This “VXSTSM index—not surprising since this new index is based on S&P 500 (SPX) option prices with at most 9 days until expiration.
There are good reasons to use a calendar day approach to annualization. It isn’t sensitive to holidays, unexpected market stoppages, or differences in trading calendars between countries. I expect that’s why it became a de facto standard in the volatility world. But the rise of shorter term volatility products like weekly options has shifted the volatility landscape enough that I think we need to at least know what is technically correct.
An analytic approach to a solution
Normally we take a shorter term (e.g., daily) volatility and multiply it by the appropriate annualizing factor to get the annualized volatility. Since the annualizing factor is the thing in question I decided to take the historical annual volatility for the last 64 years of the S&P 500 and divide it by the daily volatility to solve for the actual historical annualizing factor.
First I validated this approach with a Monte Carlo simulation1 that computed the theoretical annualizing factor for a simulated 64 year market period—and then repeated that exercise 10000 times to get the statistics of the calculation. I then applied the same calculation to the S&P 500’s returns2 over the last 64 years. The result:
The square of the annualizing factor comes is only 0.87% from the theoretical median value3 of 252 and the actual S&P 500 result of 243.5 is only 2.5% from the median value. The S&P result of 243.5 is almost 3 sigma away from the competing answer of 365.
The S&P 500 data is consistent with a 252 day based annualizing model—which doesn’t support option decay while the market is closed. The data also indicates that when you see suspiciously high short term volatility numbers at the beginning of the week you should chalk it up to flawed algorithms, not anything real in the market.
We don’t know if androids dream , but it’s clear that options slumber dreamlessly when the ticker tape halts.
Notes:
- For each day of the simulation I used the standard deviation of the previous 252 days natural log of daily returns for the short term volatility number. For the yearly return I used the simulated market value one year hence divided by the current day’s market value. Volatility drag is an important second order effect that needs to be included in the calculations.
- I offset the actual results by the average annualized growth rate to compensate for the non-zero mean of actual returns over the last 64 years
- My simulation results have a median value of 252.2 (0.08% error) if I use a volatility drag coefficient of 0.6 instead of the standard 0.5. I believe my model slightly under corrects for volatility drag .
Trading in financial instruments and/or cryptocurrencies involves high risks including the risk of losing some, or all, of your investment amount, and may not be suitable for all investors. Prices of cryptocurrencies are extremely volatile and may be affected by external factors such as financial, regulatory or political events. Trading on margin increases the financial risks.
Before deciding to trade in financial instrument or cryptocurrencies you should be fully informed of the risks and costs associated with trading the financial markets, carefully consider your investment objectives, level of experience, and risk appetite, and seek professional advice where needed.
Fusion Media would like to remind you that the data contained in this website is not necessarily real-time nor accurate. The data and prices on the website are not necessarily provided by any market or exchange, but may be provided by market makers, and so prices may not be accurate and may differ from the actual price at any given market, meaning prices are indicative and not appropriate for trading purposes. Fusion Media and any provider of the data contained in this website will not accept liability for any loss or damage as a result of your trading, or your reliance on the information contained within this website.
It is prohibited to use, store, reproduce, display, modify, transmit or distribute the data contained in this website without the explicit prior written permission of Fusion Media and/or the data provider. All intellectual property rights are reserved by the providers and/or the exchange providing the data contained in this website.
Fusion Media may be compensated by the advertisers that appear on the website, based on your interaction with the advertisements or advertisers.