Historically, How Bad Has A 'Bearish Outside Week' Been On The ASX200?
City Index | Nov 25, 2019 01:21AM ET
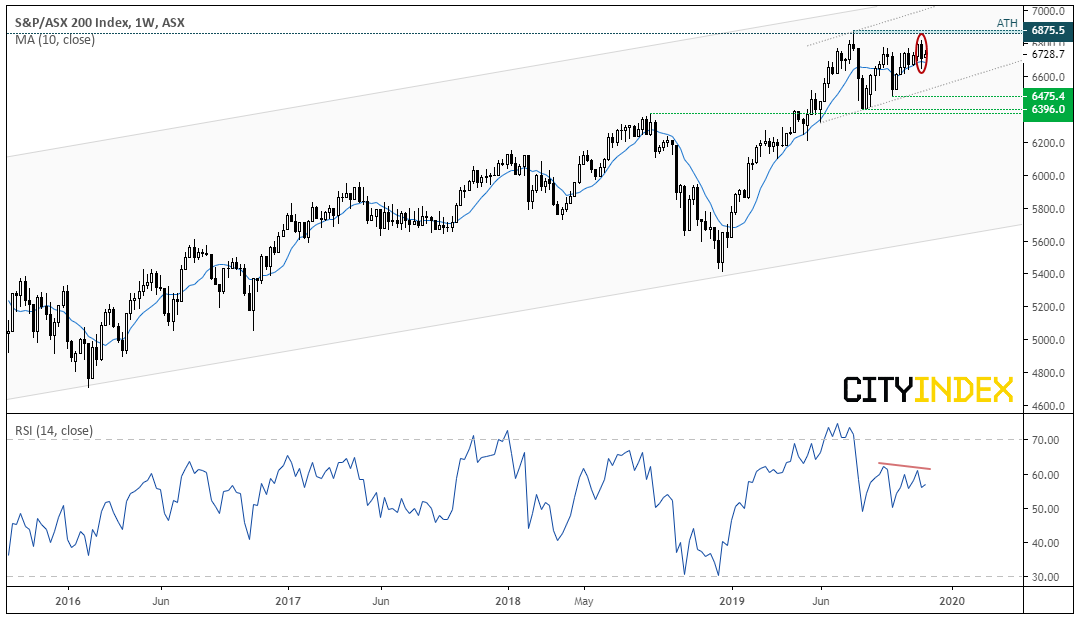
By Friday’s close, the ASX 200 had produced a bearish outside week after failing to hold above 6,800, which raises the potential for some mean reversion. Given the slight bearish divergence forming with RSI and the clear loss of momentum leading it back towards its all-time high, we explore the bearish potential of this classic candlestick pattern to see if it can pull the run from under Santa’s rally in December.
The test: Using Reuters data since April 2000, we filtered all bearish outside candles on the weekly chart. We have then calculated forward returns following a bearish outside candle, along with the % of bullish closes of the forward returns.
As we’re testing a bearish pattern, ideally we’d want to see negative returns with a % bullish rate below 50%.
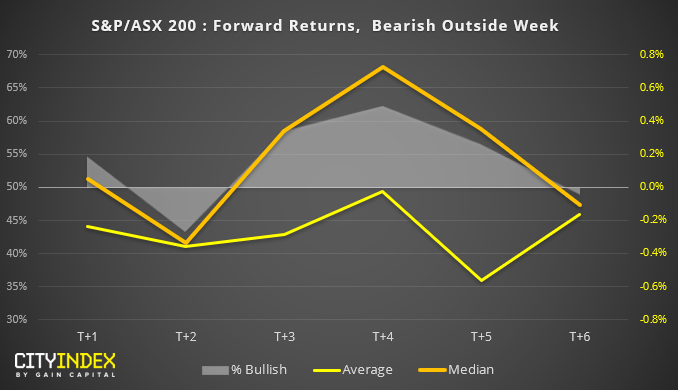
However, as this filters all bearish outside candles, trend direction has not been considered. So next we apply a rule where the pattern must close above or below its 10-week average to denote a basic trend filter.
Bearish outside day with a close above its 10-week MA
Bearish outside day with a close below its 10-week MA
Final thoughts:
Original Post
Trading in financial instruments and/or cryptocurrencies involves high risks including the risk of losing some, or all, of your investment amount, and may not be suitable for all investors. Prices of cryptocurrencies are extremely volatile and may be affected by external factors such as financial, regulatory or political events. Trading on margin increases the financial risks.
Before deciding to trade in financial instrument or cryptocurrencies you should be fully informed of the risks and costs associated with trading the financial markets, carefully consider your investment objectives, level of experience, and risk appetite, and seek professional advice where needed.
Fusion Media would like to remind you that the data contained in this website is not necessarily real-time nor accurate. The data and prices on the website are not necessarily provided by any market or exchange, but may be provided by market makers, and so prices may not be accurate and may differ from the actual price at any given market, meaning prices are indicative and not appropriate for trading purposes. Fusion Media and any provider of the data contained in this website will not accept liability for any loss or damage as a result of your trading, or your reliance on the information contained within this website.
It is prohibited to use, store, reproduce, display, modify, transmit or distribute the data contained in this website without the explicit prior written permission of Fusion Media and/or the data provider. All intellectual property rights are reserved by the providers and/or the exchange providing the data contained in this website.
Fusion Media may be compensated by the advertisers that appear on the website, based on your interaction with the advertisements or advertisers.