Highly Unusual Treasury Yield Pattern Not Seen Since Summer Of 2000
Mike (Mish) Shedlock | Sep 10, 2017 02:49AM ET
Curve watchers anonymous has taken an in-depth review of US treasury yield charts on a monthly and daily basis. There’s something going on that we have not see on a sustained basis since the summer of 2000. Some charts will show what I mean.
Monthly Treasury Yields 3-Month to 30-Year, 1998-Present
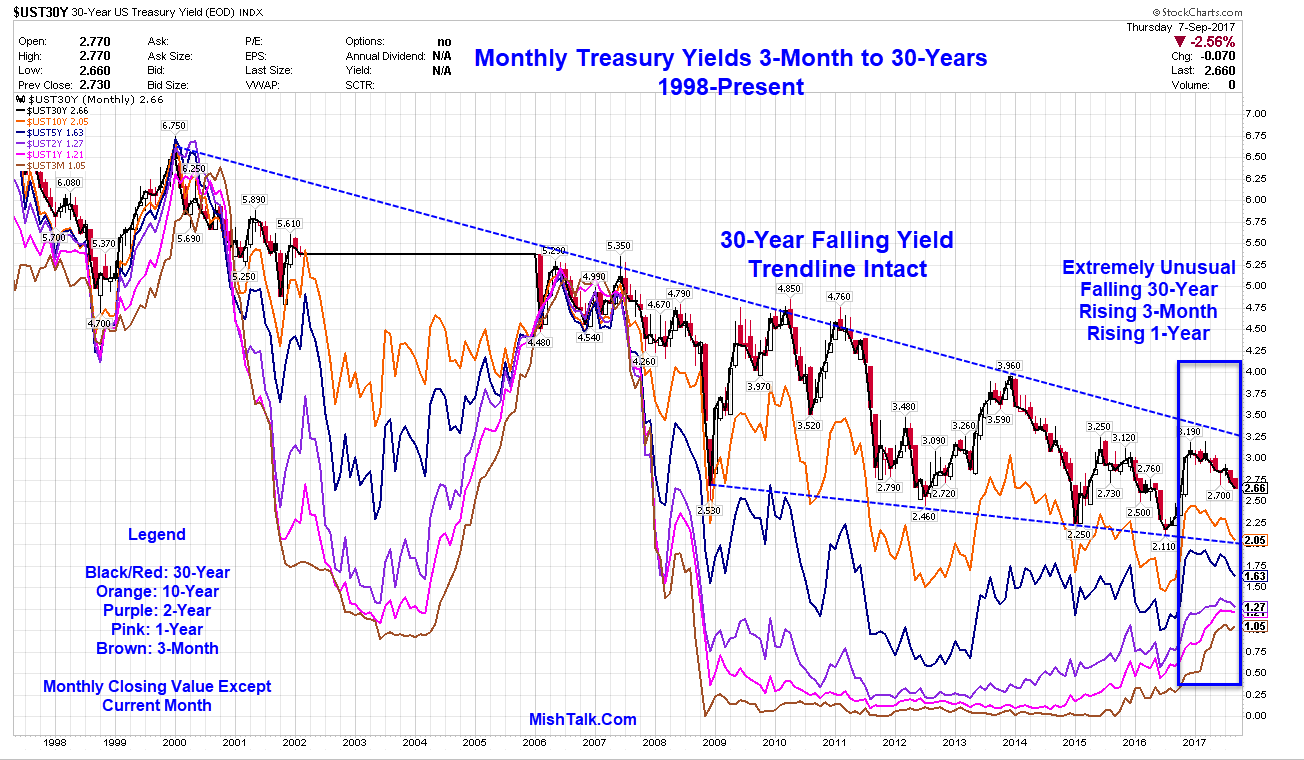
It’s very unusual to see the yield on the long bond falling for months on end while the yield on 3-month bills and 1-year note rises. It’s difficult to spot the other time that happened because of numerous inversions. A look at the yield curve for Treasuries 3-month to 5-year will make the unusual activity easier to spot.
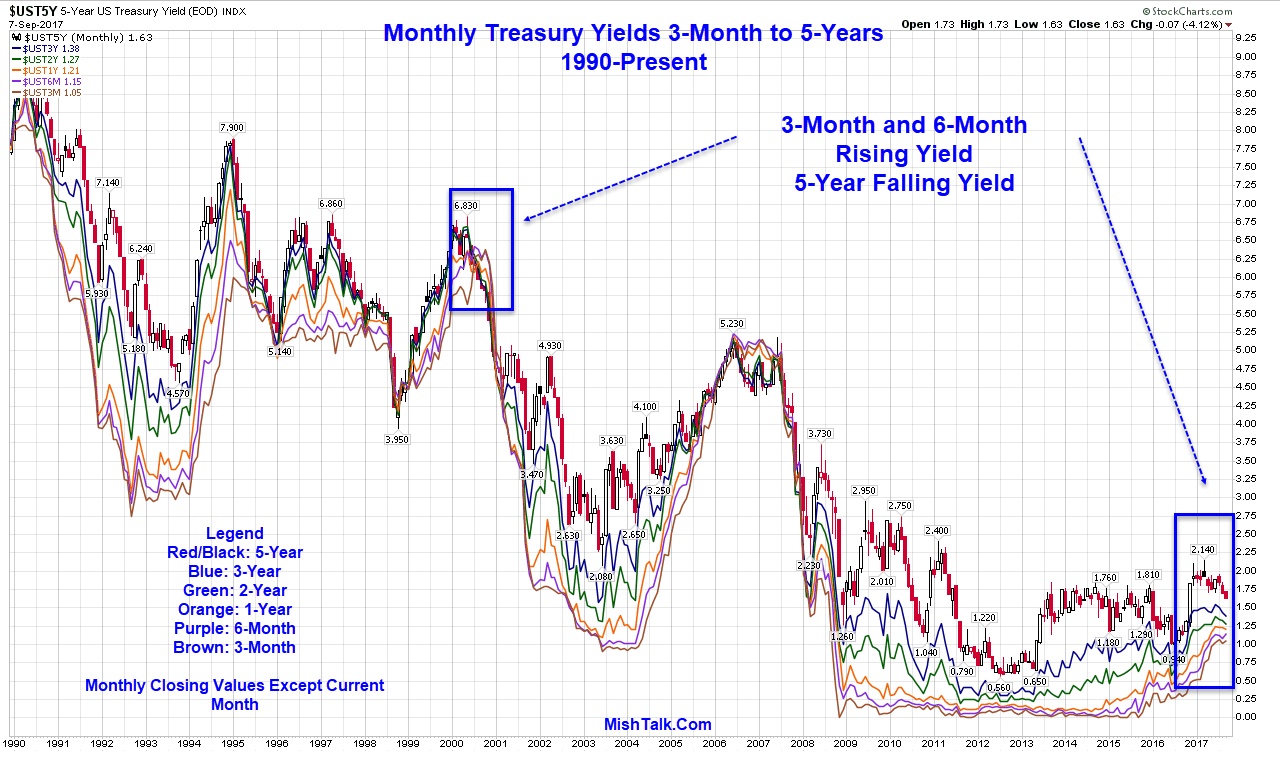
Monthly Treasury Yields 3-Month to 5-Year, 1990-Present
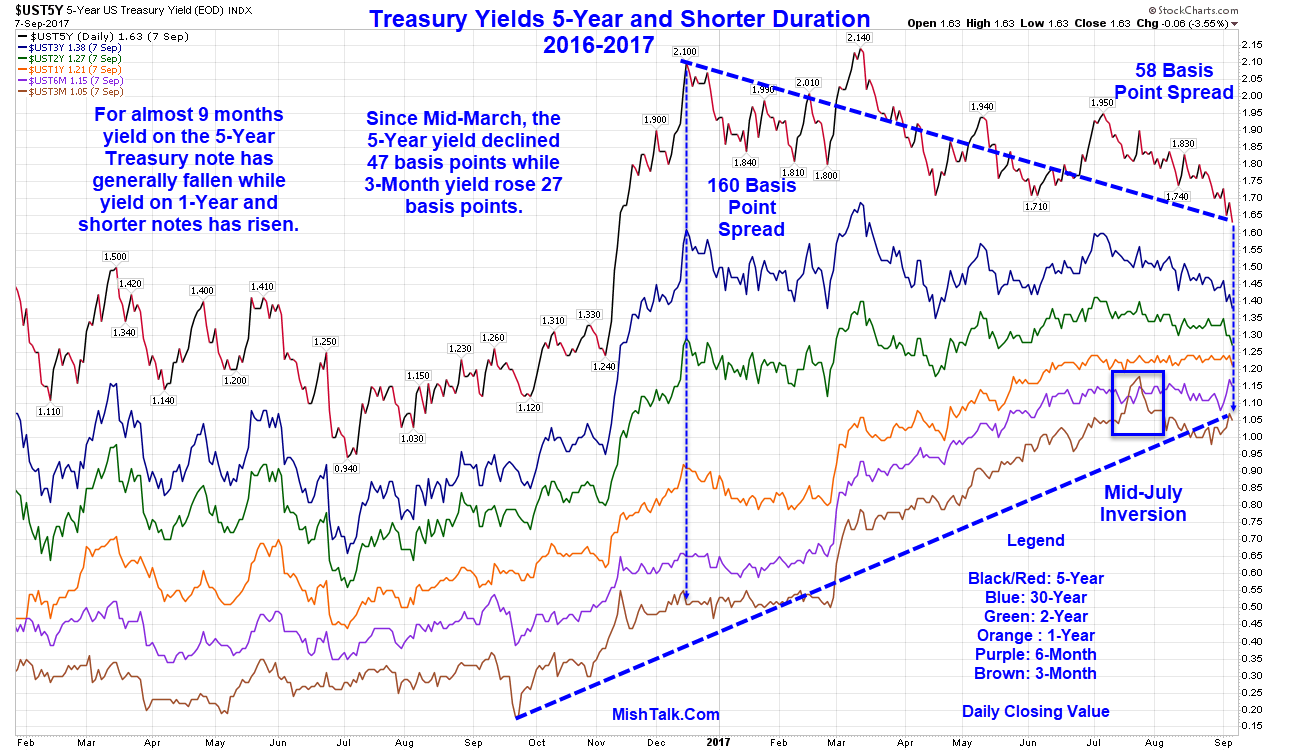
Daily Treasury Yields 3-Month to 5-Years 2016-2017
Daily Treasury Yields 3-Month to 5-Years 2000
One cannot blame this activity on hurricanes or a possible government shutdown. The timeline dates to December of 2016 or March of 2017 depending on how one draws the lines.
This action is not at all indicative of an economy that is strengthening.
Rather, this action is indicative of a market that acts as if the Fed is hiking smack in the face of a pending recession.
Hurricanes could be icing on the cake and will provide a convenient excuse for the Fed and Trump if a recession hits.
Trading in financial instruments and/or cryptocurrencies involves high risks including the risk of losing some, or all, of your investment amount, and may not be suitable for all investors. Prices of cryptocurrencies are extremely volatile and may be affected by external factors such as financial, regulatory or political events. Trading on margin increases the financial risks.
Before deciding to trade in financial instrument or cryptocurrencies you should be fully informed of the risks and costs associated with trading the financial markets, carefully consider your investment objectives, level of experience, and risk appetite, and seek professional advice where needed.
Fusion Media would like to remind you that the data contained in this website is not necessarily real-time nor accurate. The data and prices on the website are not necessarily provided by any market or exchange, but may be provided by market makers, and so prices may not be accurate and may differ from the actual price at any given market, meaning prices are indicative and not appropriate for trading purposes. Fusion Media and any provider of the data contained in this website will not accept liability for any loss or damage as a result of your trading, or your reliance on the information contained within this website.
It is prohibited to use, store, reproduce, display, modify, transmit or distribute the data contained in this website without the explicit prior written permission of Fusion Media and/or the data provider. All intellectual property rights are reserved by the providers and/or the exchange providing the data contained in this website.
Fusion Media may be compensated by the advertisers that appear on the website, based on your interaction with the advertisements or advertisers.