High Yield Corporate Bonds: Breakout Or Breakdown?
Candy Matheson | Aug 19, 2019 03:09PM ET
The High Yield Corporate Bonds ETF (NYSE:HYG) is at an interesting juncture.
There are, potentially, two uptrend lines that one could apply to form a large long-term triangle pattern on the following monthly chart. In turn, two possible triangles and two apexes emerge.
Price has been bouncing in between both apexes (and the upper edge of this triangle) since February of this year. Attempts to fully break out and move higher have failed repeatedly since then.
In the short term, I’m more interested in the upper apex (blue) because the price, once again, sits outside and below the smaller triangle, while it’s still inside the larger one.
I’ve added the rate-of-change (ROC) indicator in two formats. The input value of the first one is the default nine-period length, while I’ve changed the input value on the second one to a short one-period length.
If price breaks and holds above this upper apex, I’d monitor the second ROC indicator in the near term to see whether there is a sustained acceleration (above its zero level) to confirm support for continued buying. At the moment, it is accelerating to the downside below the zero level.
Otherwise, if it holds below this upper apex, price may decline to the lower apex, or lower, especially if the second ROC continues to accelerate on the downside.
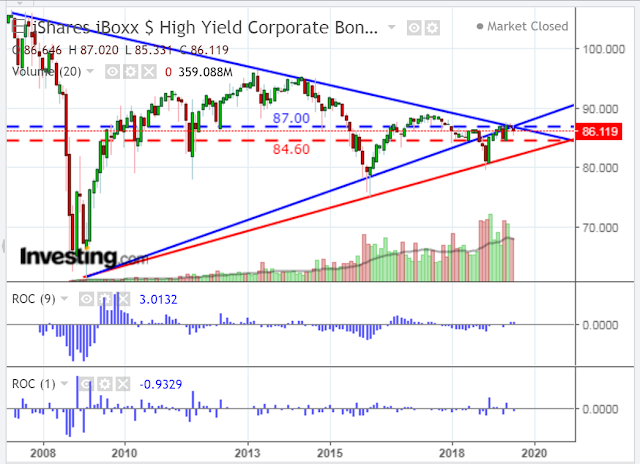
Chart powered by TradingView
![]()
Trading in financial instruments and/or cryptocurrencies involves high risks including the risk of losing some, or all, of your investment amount, and may not be suitable for all investors. Prices of cryptocurrencies are extremely volatile and may be affected by external factors such as financial, regulatory or political events. Trading on margin increases the financial risks.
Before deciding to trade in financial instrument or cryptocurrencies you should be fully informed of the risks and costs associated with trading the financial markets, carefully consider your investment objectives, level of experience, and risk appetite, and seek professional advice where needed.
Fusion Media would like to remind you that the data contained in this website is not necessarily real-time nor accurate. The data and prices on the website are not necessarily provided by any market or exchange, but may be provided by market makers, and so prices may not be accurate and may differ from the actual price at any given market, meaning prices are indicative and not appropriate for trading purposes. Fusion Media and any provider of the data contained in this website will not accept liability for any loss or damage as a result of your trading, or your reliance on the information contained within this website.
It is prohibited to use, store, reproduce, display, modify, transmit or distribute the data contained in this website without the explicit prior written permission of Fusion Media and/or the data provider. All intellectual property rights are reserved by the providers and/or the exchange providing the data contained in this website.
Fusion Media may be compensated by the advertisers that appear on the website, based on your interaction with the advertisements or advertisers.