Have Stocks Bottomed?
Sunshine Profits | Dec 07, 2021 02:25AM ET
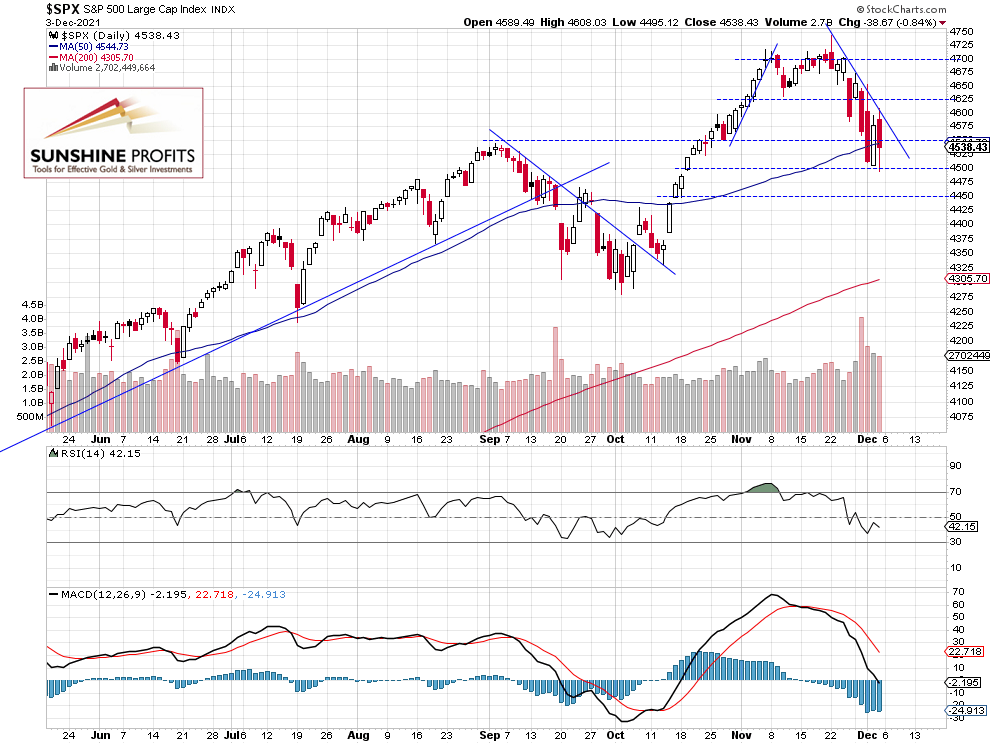
The S&P 500 index broke slightly below the 4,500 mark on Friday, but it bounced from that support level again. Is this a bottoming pattern?
The broad stock market index lost 0.84% on Friday following Thursday’s advance of 1.4%. On Friday the index fell the lowest since the Oct. 19 and it went below its early September local high of around 4,546 again.
Overall, it lost 5.24% from the Nov. 22 record high of 4,743.83. Stocks fluctuate since last week’s Wednesday, so is this a bottoming pattern? For now, it looks like a flat correction or a consolidation within a downtrend.
The nearest important support level is still at 4,500. On the other hand, the resistance level is at 4,580-4,600, marked by the recent local lows. The S&P 500 remains below its short-term downward trend line, as we can see on the daily chart (chart by courtesy of ):
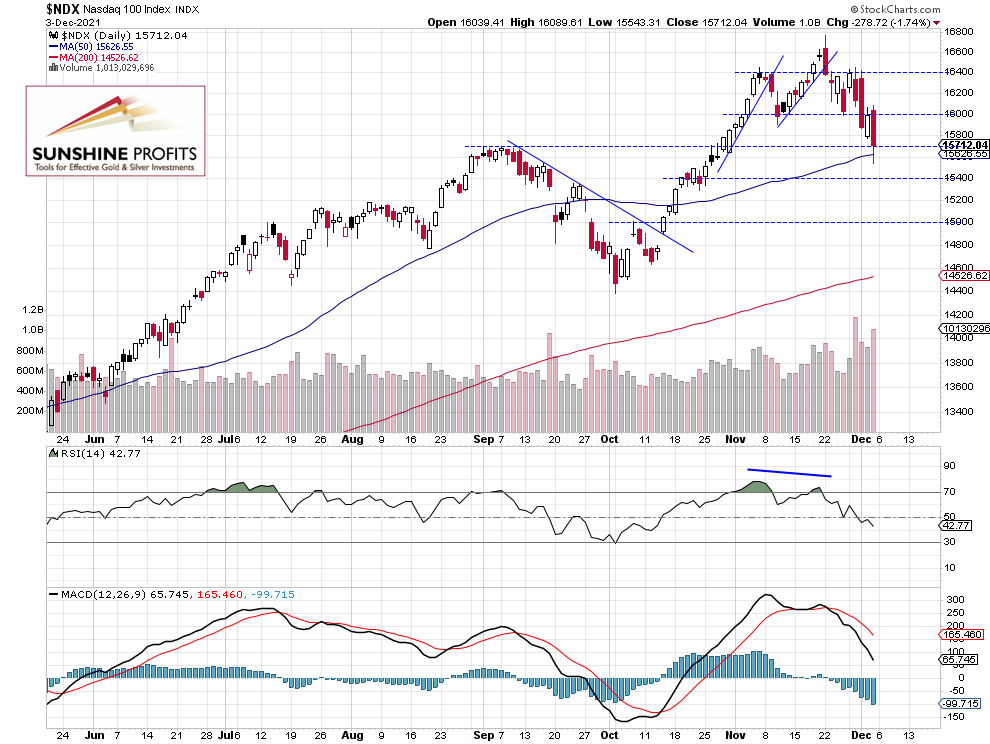
NASDAQ 100 Broke Below the 16,000 Level
Let’s take a look at the NASDAQ 100 chart. The technology index remained relatively stronger than the broad stock market recently but on Friday it broke below the support level of 16,000 and it was relatively weaker than the S&P 500 index that day. The tech stocks’ gauge fell below the early September local highs, as we can see on the daily chart:
Conclusion
The S&P 500 index slightly extended its downtrend on Friday and it was 5.24% below the Nov. 22 record high. So it is still just a downward correction and not a new bear market. But we may see some more downside. For now, it looks like a consolidation within a downtrend, as there have been no confirmed positive signals so far.
Here’s the breakdown:
- The S&P 500 slightly extended its short-term downtrend on Friday.
- A speculative short position is still justified from the risk/reward perspective.
- We are expecting an over 5% correction.
Trading in financial instruments and/or cryptocurrencies involves high risks including the risk of losing some, or all, of your investment amount, and may not be suitable for all investors. Prices of cryptocurrencies are extremely volatile and may be affected by external factors such as financial, regulatory or political events. Trading on margin increases the financial risks.
Before deciding to trade in financial instrument or cryptocurrencies you should be fully informed of the risks and costs associated with trading the financial markets, carefully consider your investment objectives, level of experience, and risk appetite, and seek professional advice where needed.
Fusion Media would like to remind you that the data contained in this website is not necessarily real-time nor accurate. The data and prices on the website are not necessarily provided by any market or exchange, but may be provided by market makers, and so prices may not be accurate and may differ from the actual price at any given market, meaning prices are indicative and not appropriate for trading purposes. Fusion Media and any provider of the data contained in this website will not accept liability for any loss or damage as a result of your trading, or your reliance on the information contained within this website.
It is prohibited to use, store, reproduce, display, modify, transmit or distribute the data contained in this website without the explicit prior written permission of Fusion Media and/or the data provider. All intellectual property rights are reserved by the providers and/or the exchange providing the data contained in this website.
Fusion Media may be compensated by the advertisers that appear on the website, based on your interaction with the advertisements or advertisers.