Growth Stocks Continue to Outpace Value as Style Divergence Persists in 2025
Brian Gilmartin | Jun 30, 2025 01:04AM ET
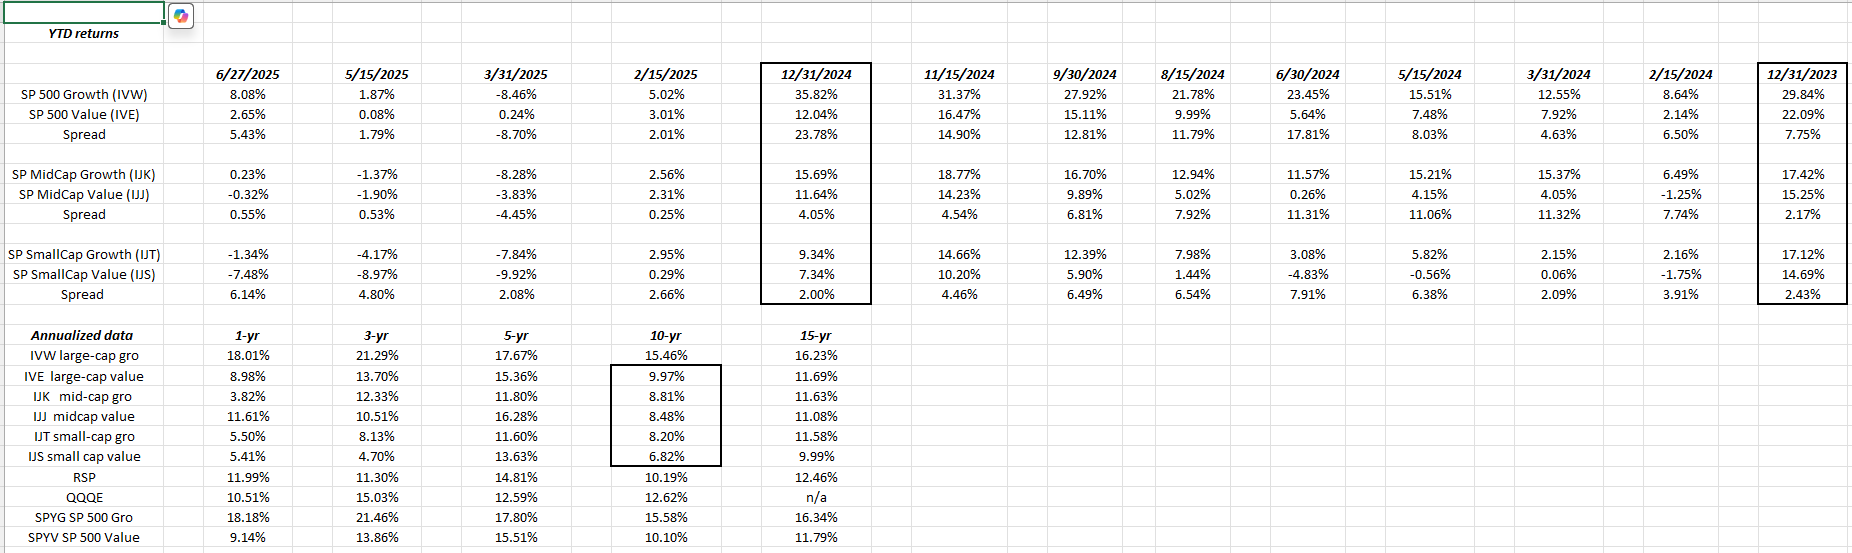
Return data courtesy of Morningstar, Inc.
Probably of little surprise to readers, but the growth style of investing continues to beat value looking at year-to-date returns, although by smaller amounts than the previous years, which is also understandable given that the S&P 500 has returned just 5.55% YTD in 2025, versus the 25% returns for the S&P 500 in 2023 and 2024.
SP 400 MidCap annual returns vs the S&P 500: (annual return)
- 1/1/2000 through 6/27/205: The MidCap ETF (MDY) returned +9.20% while the S&P 500 returned +7.78%;
- 1/1/2010 through 6/27/2025: Midcaps returned +11.25% while the S&P 500 returned +13.82%;
- 1/1/2015 through 6/27/2025: Midcaps returned +8.88%, vs the S&P 500’s +13.05%;
- 1/1/2020 through 6/27/2025: Midcaps returned +9.16% vs the S&P 500’s +14.29%;
Midcap performance relative to S&P 500:
- 1/1/2000 – 6/27/2025: 142 bp’s per year outperformance;
- 1/1/2010 – 6/27/2025: -257 bp’s per year underperformance;
- 1/1/2015 – 6/27/2025: -417 bp’s per year underperformance;
- 1/1/2020 – 513 bp’s per year underperformance;
Russell 2000 vs the S&P 500: (annual return)
- 1/1/2000 through 6/27/2025: The R2k returned +7.32%, vs the SP500’s returned +7.78%;
- 1/01/2010 through 6/27/25: The R2k returned +9.85%, vs the S&P 500’s +13.82%;
- 1/01/2015 though 6/27/25: The R2k returned +7.24%, vs the S&P 500’s +13.05%;
- 01/01/2020 through 6/27/25: The R2k returned +6.24% vs the S&P 500’s +14.29%;
Russell 2000 performance relative to S&P 500:
- 1/1/2000 – 6/27/2025: -46 bp’s per year underperformance;
- 1/1/2010 – 6/27/2025: -397 bp’s per year underperformance;
- 1/1/2015 – 6/27/2025: -581 bp’s per year underperformance;
- 1/1/20 – 6/27/2025: -805 bp’s per year underperformance;
Conclusion:
First, apologies to readers for cutting off the end data for the annual return data as of June 27th, but the time it took to develop and write this post couldn’t have been done on July 1 ’25, given other tasks. Besides, will June 30th make enough of a difference in annual return data, dating back 5,10, 15 and 25 years? Probably not.
The Russell 2000 (R2k, i.e. small-cap benchmark) is getting a lot of ink lately for it’s relative performance versus the S&P 500, and for good reason, but what’s not been mentioned is the R2K’s relative performance is getting uglier the more recent the timeframe.
Also what I found interesting is that mid-cap’s (SP 400) are all but ignored in the discussion.
It was surprising to see that the SP 500 (NYSE:MDY) actually outperformed the S&P 500 the 25.5 years, from January 1, 2000, by 142 bp’s a year. (That’s not too shabby.) (Another aspect that requires explanation for readers is that YCharts, which has a date-to-date performance calculator (a poor man’s Bloomberg) doesn’t have a “SP 400 Mid-Cap Total Return” category, so the MDY or the SPDR MidCap Blend ETF is used as the proxy for the benchmark.
Looking at the style-box spreadsheet at the very top of the page, the 10-year returns for both the MidCap and Russell 2000 style boxes are still below 10%. Small-cap value, if you look at some of the bigger ETF’s like iShares S&P Small-Cap 600 Value ETF (NYSE:IJS) and iShares Russell 2000 Value ETF (NYSE:IWN) both show that the financial sector has a weighting in each ETF of 25%.
What’s a potential catalyst for the small cap financials? After financials, industrials were the next largest sector, and then consumer cyclicals.
The blog keeps an eye on this stuff, just to touch all the bases in the various segments of the equity market that have been less-emphasized or given less press attention the last 5 years.
The spreadsheet at the top gives YTD returns and then shows how the various style boxes performed the last two calendar years.
Disclaimer: None of this is advice or a recommendation but only an opinion. Past performance is no guarantee of future results. None of this information may be updated and if updated may not be done so in a timely fashion. Readers and investors should evaluate their own comfort with market volatility and adjust accordingly.
Thanks for reading.
Trading in financial instruments and/or cryptocurrencies involves high risks including the risk of losing some, or all, of your investment amount, and may not be suitable for all investors. Prices of cryptocurrencies are extremely volatile and may be affected by external factors such as financial, regulatory or political events. Trading on margin increases the financial risks.
Before deciding to trade in financial instrument or cryptocurrencies you should be fully informed of the risks and costs associated with trading the financial markets, carefully consider your investment objectives, level of experience, and risk appetite, and seek professional advice where needed.
Fusion Media would like to remind you that the data contained in this website is not necessarily real-time nor accurate. The data and prices on the website are not necessarily provided by any market or exchange, but may be provided by market makers, and so prices may not be accurate and may differ from the actual price at any given market, meaning prices are indicative and not appropriate for trading purposes. Fusion Media and any provider of the data contained in this website will not accept liability for any loss or damage as a result of your trading, or your reliance on the information contained within this website.
It is prohibited to use, store, reproduce, display, modify, transmit or distribute the data contained in this website without the explicit prior written permission of Fusion Media and/or the data provider. All intellectual property rights are reserved by the providers and/or the exchange providing the data contained in this website.
Fusion Media may be compensated by the advertisers that appear on the website, based on your interaction with the advertisements or advertisers.