Alphabet Inc. Stock Is A Temptation To Resist
EWM Interactive | Apr 26, 2017 06:32AM ET
Alphabet Inc. (NASDAQ:GOOGL) topped $600 billion market capitalization, after its stock closed at a new all-time high of $888.84 per share yesterday. This, plus the fact that it is a great, highly profitable company, could easily tempt investors to jump on board, hoping that the best is yet to come. For the business, this is probably true, but the market is not always rational and the weekly price chart of GOOGL stock seems to be flashing a warning sign.
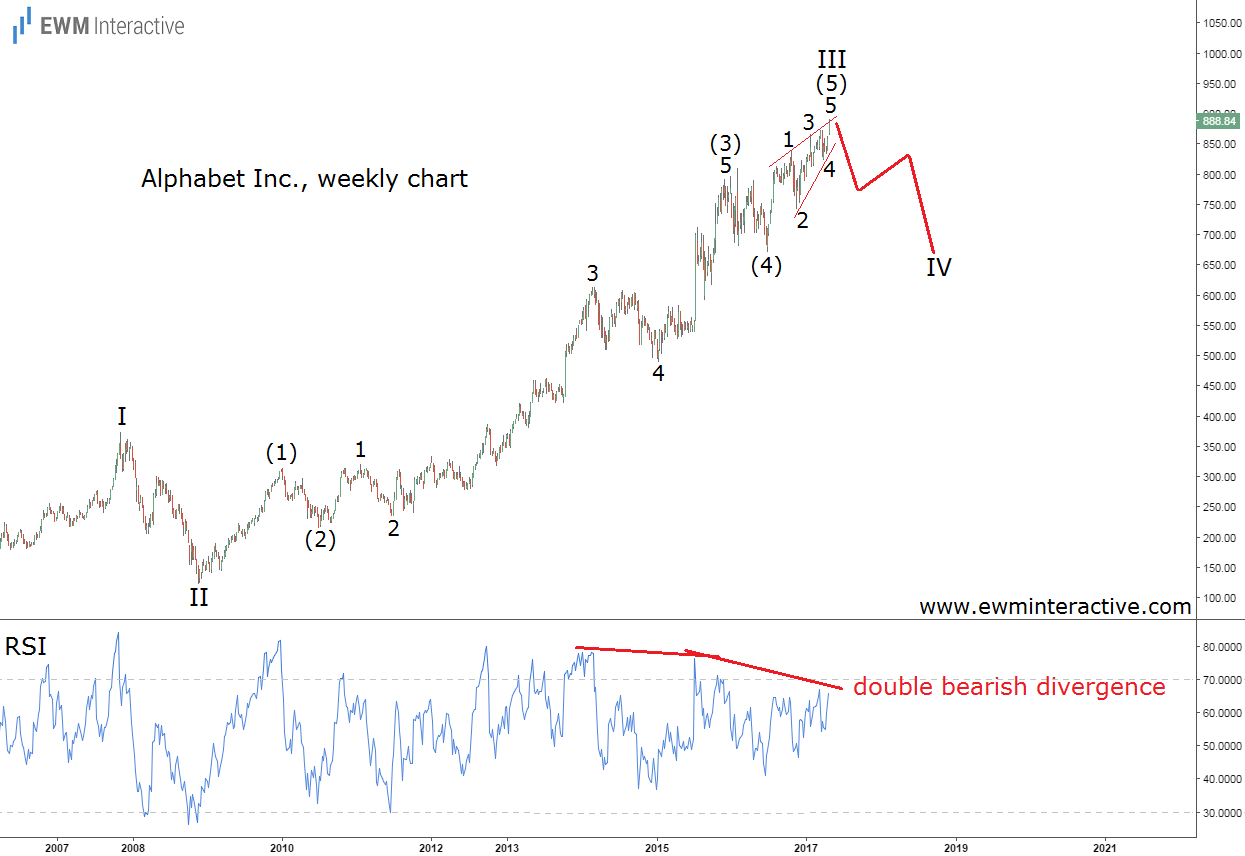
The weekly chart of GOOGL stock visualizes the entire uptrend since the low near $124 a share in November, 2008. According to the divergence between the last three major highs. In fact, the indicator started diverging back in February, 2014, when Alphabet’s stock price was hovering around $600 a share. Three years and almost $300 per share to the north later, GOOGL stock’s trend seems more exhausted than ever.
However, this is not a sell recommendation. The trend is still up and picking tops is among the riskiest things one could do. On the other hand, we believe it is too late to buy either. Fourth waves usually retrace back to the support area of the previous fourth wave. In this case, GOOGL stock could be expected to decline back to $700 from now on.
Original post
![]()
Trading in financial instruments and/or cryptocurrencies involves high risks including the risk of losing some, or all, of your investment amount, and may not be suitable for all investors. Prices of cryptocurrencies are extremely volatile and may be affected by external factors such as financial, regulatory or political events. Trading on margin increases the financial risks.
Before deciding to trade in financial instrument or cryptocurrencies you should be fully informed of the risks and costs associated with trading the financial markets, carefully consider your investment objectives, level of experience, and risk appetite, and seek professional advice where needed.
Fusion Media would like to remind you that the data contained in this website is not necessarily real-time nor accurate. The data and prices on the website are not necessarily provided by any market or exchange, but may be provided by market makers, and so prices may not be accurate and may differ from the actual price at any given market, meaning prices are indicative and not appropriate for trading purposes. Fusion Media and any provider of the data contained in this website will not accept liability for any loss or damage as a result of your trading, or your reliance on the information contained within this website.
It is prohibited to use, store, reproduce, display, modify, transmit or distribute the data contained in this website without the explicit prior written permission of Fusion Media and/or the data provider. All intellectual property rights are reserved by the providers and/or the exchange providing the data contained in this website.
Fusion Media may be compensated by the advertisers that appear on the website, based on your interaction with the advertisements or advertisers.