Gold’s Momentous Rally Compared To SPY & QQQ – Part I
Chris Vermeulen | Nov 15, 2020 01:53AM ET
My research team and I went off on a wild tangent trying to identify how the markets could react to the recent spike in price activity on Monday, November 9, 2020. This is the day that Pfizer (NYSE:PFE) announced a 90% effective rate with its new COVID-19 vaccine, causing the US stock market to skyrocket higher before the opening bell in New York. As with most pop-and-drops, this incredible upside spike trailed lower for the remainder of the trading day. My research team was curious if this type of setup presented any real future outcome or trends. To this end, we focused on the QQQ and the SPY in relationship to Gold futures.
9 to 9.5 year Gold Depreciation Cycle Ended in 2018 – what’s next?
Gold has been and continues to be a store of value for many around the world. At some times in history, Gold becomes undervalued in comparison to other assets (like stocks, real estate, and other tangible assets). At other times, Gold becomes more highly valued in comparison to other assets. This cycle has taken place throughout hundreds of years of history, and is rooted in the changing perceptions of market participants regarding “what/where is true value in the markets”.
When other assets are skyrocketing higher, Gold is out of favor in terms of real demand. It may still be moving higher in value, but as long as other assets seem to be increasing in value faster than Gold, demand for Gold will diminish. When most other assets enter a time of great concern or devaluation, Gold and Precious Metals usually begin to see stronger demand as the ratio between Gold prices and more traditional investment assets may be near extremes.
Many precious metals investors rely on the Gold to Silver ratio to measure how fast or slow Gold is appreciating or depreciating compared to Silver. This ratio can often be used to help pinpoint disparities between real price valuation levels. In our example, today, we’re using the ratio of the QQQ and SPY to Gold, which assesses more traditional investment asset values in comparison to Gold.
The first Monthly QQQ 2000 Anchor to Gold chart, below, attempts to highlight the past and current ratio levels based on an anchor price level starting on January 1, 2000. The purpose of this ratio chart is to understand how the price advance in the QQQ over time relates to the price advance in Gold. The higher the BLUE ratio level, the more valued QQQ is compared to Gold.
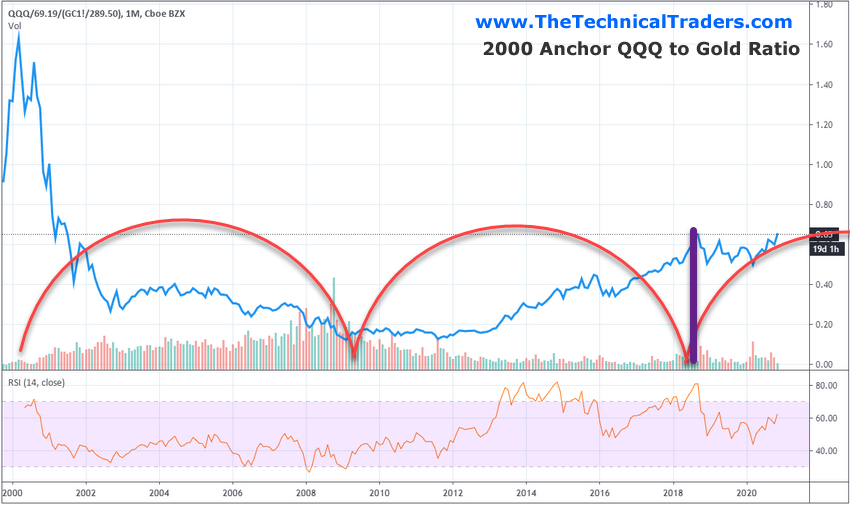
The first thing that caught our attention was the very high valuation levels in early 2000. This suggests that Gold was completely ignored in the late stages of the DOT COM rally when technology and other assets were flying high. As the DOT COM bubble burst, one would expect the ratio to decline over time. However, in this case, the ratio continued to decline over a 9 to 9.5 year period – reaching a low point in 2009 (the Global Financial Crisis lows). This downward trend in the QQQ to Gold 2000 anchor ratio suggests that while the QQQ rotated up and down in a broad sideways trend, Gold continued to appreciate in value. Throughout this time, from 2000 to 2009, Gold rallied over 215% (from $289.50 to over $931.00). This appreciation in Gold translated into the declines in the QQQ to Gold ratio on this chart above.
It was only after 2013 that the QQQ to Gold 2000 anchor chart began to rise again. Interestingly, this really began to take place after the 2011 peak in Gold prices (near $1923.70) and after the US economy really began a more organic growth phase prompted by multiple US Fed QE efforts. We can see from the chart below that the current peak levels (near 0.60) on this ratio chart are still well below the 1.60 ratio levels from 2000. Although this may appear to be a weaker ratio trend, remember this chart anchors everything to January 1, 2000 price points. So this chart reflects the QQQ to Gold ratio based on the origination ratio that existed on January 1, 2000.
COMPARISON OF QQQ, SPY AGAINST GOLD
This next ratio chart below shows the incredible rally in Gold compared to the QQQ and the SPY since the 2000 anchor point. It is important to understand that these ratios are based on the January 1, 2000 anchor price level and represent the comparative price appreciation/depreciation of these assets from that anchor point.
You can see that the QQQ and SPY were both well under the 1.0 ratio level for much of 2001 through 2013. This suggests that these assets failed to rally above the 2000 anchor price level throughout this time. Gold also experienced a brief decline in price below the 1.0 level in early 2000 through 2003, but it quickly started rallying after that point and has continued to extend higher recently.
When we compare the chart below to the one above, we can see that the rally in gold has extended quite a bit further than the rally in the QQQ and the SPY since 2000. Yet, this brings up an interesting question related to the cycles our research team has identified. Have we reached a peak level in the QQQ and SPY in relationship to the appreciation of Gold? Are we entering a new cycle where Gold will continue to appreciate higher compared to the QQQ and the SPY – attempting to recreate a nromalized ratio?
If our research team’s interpretation of this data is correct, the rally in Gold since the 2000 anchor point suggests a new momentum base has established in Gold after the 2011 peak price levels. This new momentum base, if our cycle research is accurate, suggests a broad market peak in equity/stock assets is setting up another 9 to 9.5 year precious metals appreciation cycle that started near 2019. This could be an incredible opportunity for skilled technical traders over the next 8+ years if we understand what to expect based on these cycles/trends.
In this first part of our two-part Gold series this weekend, we have illustrated the longer-term cycle patterns that originated from an anchor point in 2000 and the real appreciation in Gold compared to other assets. In Part II, we will share incredible new information that suggests we are near another 2000-like peak in equities/stocks, suggesting another broad metals rally is just starting and may last another 8+ years.
This does not mean that stocks will collapse or some external event won’t destroy the stock market valuations or the thesis presented. We are merely suggesting that Metals have established a base level (near 2015) while traders have focused on the equities/stocks recently and ignored metals. This rally in stocks/equities suggests that metals have under-appreciated compared to stocks/equities. This disparity in price valuations also suggests that either metals will rally to attempt to close the price disparity or that equities will decline or trade sideways while metals attempt to close the gap.
Overall, this is an incredible longer-term cycle setup that traders must keep in focus over the next few years. If this type of cycle repeats like it did after 2000, then Gold may be trading above $5500 per ounce within the next 2 to 3 years and may peak at levels above $10,000 before the peak is reached.
Trading in financial instruments and/or cryptocurrencies involves high risks including the risk of losing some, or all, of your investment amount, and may not be suitable for all investors. Prices of cryptocurrencies are extremely volatile and may be affected by external factors such as financial, regulatory or political events. Trading on margin increases the financial risks.
Before deciding to trade in financial instrument or cryptocurrencies you should be fully informed of the risks and costs associated with trading the financial markets, carefully consider your investment objectives, level of experience, and risk appetite, and seek professional advice where needed.
Fusion Media would like to remind you that the data contained in this website is not necessarily real-time nor accurate. The data and prices on the website are not necessarily provided by any market or exchange, but may be provided by market makers, and so prices may not be accurate and may differ from the actual price at any given market, meaning prices are indicative and not appropriate for trading purposes. Fusion Media and any provider of the data contained in this website will not accept liability for any loss or damage as a result of your trading, or your reliance on the information contained within this website.
It is prohibited to use, store, reproduce, display, modify, transmit or distribute the data contained in this website without the explicit prior written permission of Fusion Media and/or the data provider. All intellectual property rights are reserved by the providers and/or the exchange providing the data contained in this website.
Fusion Media may be compensated by the advertisers that appear on the website, based on your interaction with the advertisements or advertisers.