Gold’s Mild Pullback
Adam Hamilton | Jan 26, 2024 02:33PM ET
Gold bearishness has flared considerably during recent weeks’ selloff. But that’s merely been a mild pullback, neither big nor sharp. The gold-futures selling that’s driven it has been relatively modest. Such periodic retreats within ongoing uplegs are essential to keep sentiment balanced. Pullbacks are actually quite bullish, bleeding off excess greed paving the way for more buying as gold continues powering higher.
Gold’s young upleg has already proven impressive. It was born in early October after a correction-grade 11.3% selloff. In the markets, selloffs are defined based on their size. Pullbacks are simply minor sub-10% selloffs leaving existing uplegs intact. Corrections are larger major selloffs running from 10% to 20% that formally slay uplegs. Then bear-market territory is beyond that at 20%+ total losses from recent highs.
This latest upleg was born after gold suffered an anomalous violent breakdown in late September. That unsustainable selling soon gave way to big mean-reversion buying, catapulting gold sharply higher in much of October and November. Then in early and late December, gold achieved two new nominal all-time-record closing highs. The former was the first in 3.3 years, a momentous event portending a big upleg.
The latter was gold’s $2,077 close on December 27th, leaving its upleg up 14.2% over 2.7 months. That wasn’t very big by modern gold standards, and gold didn’t get overbought. Recent years’ uplegs include a 26.3% one cresting in early May 2023, an 18.9% one into early March 2022, and back-to-back 40.0% and 42.7% monsters topping out in early August 2020 and early March 2020! Gold’s latest upleg remains immature.
A key warning sign gold uplegs risk soon topping out is overboughtness. A great measure of that looks at price levels relative to their trailing 200-day moving averages. During the last five years or so, gold has generally seen major toppings when stretched 15%+ above its 200dma. Gold was nowhere near that in late December 2023, merely 6% over its 200dma! So there were no technical reasons for this upleg to fail.
Major gold uplegs are fueled by three stages of sequential progressively-larger buying. Their initial surges are driven by stage-one gold-futures short covering. Within weeks that drives gold high enough for long enough to entice back much-bigger stage-two gold-futures long buying. That accelerates gold’s gains, leaving them big enough within months to start attracting back investors’ massive stage-three buying.
Had these been largely exhausted in late December, gold probably would’ve carved a major interim high leading into a correction. But as this chart reveals, that certainly wasn’t the case a few weeks ago. Gold prices are superimposed over speculators’ positioning in gold-futures long and short contracts. These are reported weekly in the Commitments of Traders reports. Today’s gold upleg had and has lots of buying left.
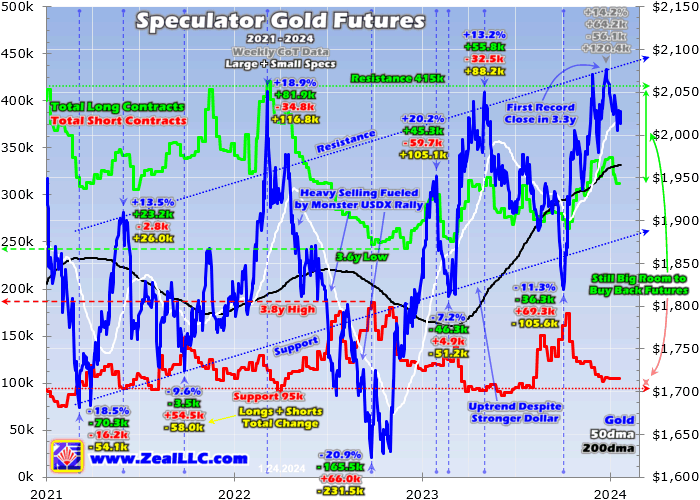
Specs’ gold-futures shorts are considerably smaller than their longs, as evident in this lower red line. Secular support for spec shorts has run near 95k contracts in recent years. That means stage-one short-covering buying initially fueling gold uplegs is likely to run until shorts fall back to 95k. That has mostly-but-not-fully happened. Total spec shorts ran 105.5k in late December, and have flatlined right there since.
They were still 104.6k in the latest CoT report before this essay was published, current to January 16th. It’s normal for short covering to quickly exhaust itself early in major gold uplegs. Gold-futures trading is exceedingly risky due to the extreme leverage involved. Midweek that ran as high as 24.3x, with each contract controlling 100 ounces of gold worth $201,300 only requiring cash margins of $8,300 to trade!
So when gold inevitably rebounds out of a selloff, short-side specs have to exit fast or face ruin. At 24x, a mere 4.2% gold rally wipes out 100% of their capital risked. These guys are quick to buy to cover to close out their short trades, so stage-one buying tends to only last for weeks. That is largely expended now, with only 9.6k more potential short covering until 95k support. Stage one is gold uplegs’ smallest by far.
But it ignites much-larger stage-two long buying. In late December when gold achieved that nominal record $2,077 close, total spec longs were running 337.9k contracts. In the several weeks since, they’ve fallen back to 312.0k per the latest CoT. That collective 25.9k contracts of net long selling is the dominant reason gold has pulled back since. Gold futures’ crazy leverage gives them outsized influence on gold prices.
At 24x, each dollar in gold futures has 24x the price impact on gold as a dollar invested outright! The specs exited gold-futures longs in recent weeks because the US dollar bounced sharply. These guys look to the US Dollar Index for their primary trading cues, then do the opposite. That in turn is driven by Fed rate expectations, which are always shifting on FOMC decisions, Fedspeak, and major economic data.
When this latest gold upleg powered 14.2% higher between early October to late December, the USDX fell a big-for-it 5.1%. The US Dollar plunged in November and December on mounting Fed-rate-cut odds, and bottomed at quite-oversold levels the same day gold hit $2,077! Since then the dollar has bounced hard, driving the gold-futures long selling responsible for gold’s recent mild pullback. And it truly has been mild.
Over several weeks from late December to mid-January, gold slumped a mere 3.4% to $2,006! That’s even small by pullback standards. Just like selloffs rebalance sentiment in uplegs, rallies do the same in downlegs. The US Dollar Index’s big 2.4% surge in that same span was a corrective rally, bleeding off excessive fear and rebalancing sentiment. Bearish dollar fundamentals argue it shouldn’t last much longer.
Circling back to spec gold-futures longs, their secular upper resistance in recent years has run near 415k contracts. That latest CoT read at just 312.0k is a whopping 103.0k under there, the amount of probable stage-two buying left! And in late December at gold’s latest interim high, there was still big room for 77.1k of buying. It’s highly unlikely this gold upleg crested then with over half of likely stage-two buying remaining!
In early October, spec longs bottomed with gold at 264.8k contracts. That left room for total stage-two buying of 150.2k before upper resistance is challenged. But just 73.1k or 49% of that had been expended in late December. So gold’s young upleg is almost certainly not over yet, with lots of spec long buying still coming to catapult gold to more record highs. And stage-three investment buying hasn’t even started yet.
As I analyzed in a whole essay last week, gold investment has been dead recently. While hard numbers are only published quarterly by the World Gold Council, the combined holdings of the world’s dominant gold ETFs have proven a great daily proxy. Those are the mighty American GLD (NYSE:GLD) and IAU ETFs, which act as conduits for US stock-market capital to slosh into and out of gold. Investors haven’t participated at all.
During those 2.7 months where gold powered 14.2% higher to nominal record closes, GLD+IAU holdings only edged up 0.2%! They were effectively dead-flat, implying no identifiable investment demand for gold at all. Investors are the last to return to gold in major uplegs. While they love chasing upside momentum, gold has to power higher on balance for some time to return to their radars. That hasn’t happened yet.
So when this young gold upleg grew to 14.2% gains several weeks ago, vast buying remained. While stage-one gold-futures short covering was largely expended, over half of probable stage-two long buying hadn’t happened yet. And in addition to that serious capital firepower to drive gold much higher, stage-three investment demand hadn’t even begun. That means there’s almost zero chance this gold upleg is over.
Gold’s recent mild pullback is looking much more like a mid-upleg one too. At worst so far, gold has only retreated 3.4% in 13 trading days. This young upleg’s lower support has held, and even at $2,006 gold hasn’t broken decisively below its 50-day moving average. 50dmas are often pullback targets within ongoing uplegs, while lower 200dmas provide more support in corrections. Technically gold is looking great!
With these bullish technicals so obvious on any six-month chart, normally I wouldn’t bother writing an essay like this. But the sentiment damage to gold in recent weeks has been considerably larger than a mild pullback should generate. That is evident in silver and gold stocks, which effectively trade as gold proxies most of the time. Silver fell 7.1% during gold’s pullback, while the GDX (NYSE:GDX) gold-stock index plunged 14.1%!
Normally the major gold stocks amplify material gold moves by 2x to 3x, but GDX’s downside leverage shot up to 4.1x in recent weeks! That implies gold psychology has shifted much more bearish than a little selloff necessitates. That’s actually quite bullish for gold’s young upleg, as the faster selloffs bleed off greed and generate fear the quicker they run their courses. Several factors are dampening enthusiasm.
Gold has suffered a huge disconnect from inflation in the last few years, eroding confidence in it. The Fed’s monster rate hikes in mid-2022 ignited a colossal 16.7% USDX moonshot, unleashing withering gold-futures selling right as inflation was raging. So gold plunged 20.9% into a new bear just when it should’ve been strongest! Though fully reversed by mid-2023, that extreme anomaly sure soured traders on gold.
So the yellow metal needs to prove itself again, rallying higher and longer than usual to rebuild interest and confidence. Not even December’s pair of nominal record highs was enough yet to overcome mid-2022’s heaps of bad will. Also the powerful stock-market surge in November and December has been a big distraction. The soaring euphoria and greed that’s generating has stolen all the market limelight recently.
Gold tends to move counter to stock markets, making it a great portfolio diversifier. But when stocks are challenging record highs, prudent diversification is forgotten. Alternative assets led by gold tend to shine again as lofty stock markets decisively roll over. With the elite S&P 500 companies averaging dangerous bubble-level 30.3x trailing-twelve-month price-to-earnings ratios entering January, that reckoning is looming.
While near-mania stock markets distract investors, gold-futures speculators face more uncertainty than usual in a young gold upleg due to the Fed. While its epic rate-hike cycle is over, the transition to dollar-bearish gold-bullish cuts is turbulent. Fed officials are arguing they want to keep rates higher for longer, while traders are seizing on any Fed-dovish news to expect cuts sooner. This dynamic swings back and forth.
That has upped short-term volatility in the US dollar, leaving gold-futures speculators warier of committing too much capital to chasing gold’s young upleg. But all this is temporary. Gold will eventually power high enough for long enough to restore normal sentiment after mid-2022’s anomalous pounding. These super-high US stock markets will roll over into a correction-grade selloff sooner or later, if not a major new bear.
And the Fed’s choppy shift from hiking to cutting will pass, leaving a new rate-cut cycle in place for some time. As all that unfolds, speculators will increasingly resume their stage-two long buying. That will drive gold up to more new record closes, putting it back on more investors’ radars. They will start chasing its strong upside momentum, supercharging this upleg. With new records, it has great potential to grow very large.
The financial media loves covering record highs, bullishly reflecting the popular greed they fuel. That greatly increases awareness of a sector’s gains beyond its usual constituents, which in gold’s case are primarily contrarians. The more new nominal records gold achieves, the more bullish coverage it earns. That increasingly attracts in investors who normally wouldn’t deploy capital in gold, really growing demand.
Case in point were the last two gold uplegs achieving record highs, which both crested in 2020. The first soared 42.7% in 18.8 months into early March, then the second another 40.0% over 4.6 months into early August. During their spans, such vast investment capital flooded into gold to chase its big gains that GLD+IAU holdings soared 30.4% or 314.2 metric tons during the first and 35.3% or 460.5t in the second!
Truly gold-record momentum is a sight to behold, and today’s young gold upleg is the first since 2020 to achieve new records! And a lot more are coming as gold continues powering higher on balance. Every close over $2,077 is a new nominal record. Even if this upleg disappoints and only clocks in at 25% gains, that would still leave gold at $2,275 guaranteeing many more record closes to attract investors.
So the disproportionally-bearish sentiment unleashed by gold’s mild pullback is really misplaced. As the USDX’s oversold bounce ends soon, gold-futures buying will resume driving gold to new records. Those gold proxies of silver and the gold stocks will blast higher with gold, quickly regaining their usual upside leverage. With lots of gold-futures buying and all the investment buying left, gold still has a long ways to run.
The biggest beneficiaries of much-higher prevailing gold prices as that momentum buying resumes will be the gold miners’ stocks. The GDX majors soared 134.1% during gold’s last mighty 40.0% upleg in mid-2020 seeing new records fueled by investors flooding back in. Smaller fundamentally-superior mid-tiers and juniors tend to well outperform, and our newsletter trading books are currently full of cheap great ones.
The bottom line is gold merely suffered a mild pullback in recent weeks. Technically this upleg still looks great, with major support zones intact. Yet bearishness has flared dramatically as evident in big parallel drops in the main gold proxies. That’s actually quite bullish, as mid-upleg selloffs exist to bleed off greed and rebalance sentiment. And the great majority of usual gold-upleg buying remains to drive gold much higher.
While speculators’ likely gold-futures short covering is largely exhausted, just half their larger probable long buying was spent at gold’s recent record high. And the vastly-bigger investment buying that fuels major record-achieving uplegs hasn’t even started yet. So this pullback is offering good opportunities for traders to add positions in gold, silver, and their miners’ stocks. Gold’s young upleg has a long ways to run yet.
Trading in financial instruments and/or cryptocurrencies involves high risks including the risk of losing some, or all, of your investment amount, and may not be suitable for all investors. Prices of cryptocurrencies are extremely volatile and may be affected by external factors such as financial, regulatory or political events. Trading on margin increases the financial risks.
Before deciding to trade in financial instrument or cryptocurrencies you should be fully informed of the risks and costs associated with trading the financial markets, carefully consider your investment objectives, level of experience, and risk appetite, and seek professional advice where needed.
Fusion Media would like to remind you that the data contained in this website is not necessarily real-time nor accurate. The data and prices on the website are not necessarily provided by any market or exchange, but may be provided by market makers, and so prices may not be accurate and may differ from the actual price at any given market, meaning prices are indicative and not appropriate for trading purposes. Fusion Media and any provider of the data contained in this website will not accept liability for any loss or damage as a result of your trading, or your reliance on the information contained within this website.
It is prohibited to use, store, reproduce, display, modify, transmit or distribute the data contained in this website without the explicit prior written permission of Fusion Media and/or the data provider. All intellectual property rights are reserved by the providers and/or the exchange providing the data contained in this website.
Fusion Media may be compensated by the advertisers that appear on the website, based on your interaction with the advertisements or advertisers.