Gold’s Leading Indicators: Has Anything Changed?
Jordan Roy-Byrne, CMT | Jun 27, 2021 12:08AM ET
You would have to be blind, metaphorically speaking, not to see that Gold is back in correction mode.
It never traded above the corrective highs around $1950, and more importantly, it has formed a nasty bearish engulfing candle on the monthly chart after testing the important $1900 resistance level.
That’s fine. This is all part of the handle correction of the now 10-year long cup pattern.
Yesterday in a video analysis , I argued that Gold is the macro leader.
In recent years, Gold (and even Silver) have led moves in the US Dollar. As the currency has turned lower and lower, other commodities have dramatically outperformed the precious metals.
Yes, the current rebound in the US dollar is a problem for fold and silver, but recent history argues that precious metals (and gold especially) should bottom and turn up before the US dollar turns down again.
The way to gauge that is to follow gold’s performance against foreign currencies, which is a fairly consistent leading indicator for the sector. For example, it advanced to a new all-time high last summer, before gold.
There are no official leading indicators, but I plot some in the chart below.
When we look at gold during a correction, we want to see how it performs against foreign currencies and the stock market.
With regard to the gold stocks, we want to see how they are performing against gold and the stock market. The VanEck Vectors Gold Miners ETF (NYSE:GDX) advance-decline line (not shown) is also an important leading indicator.
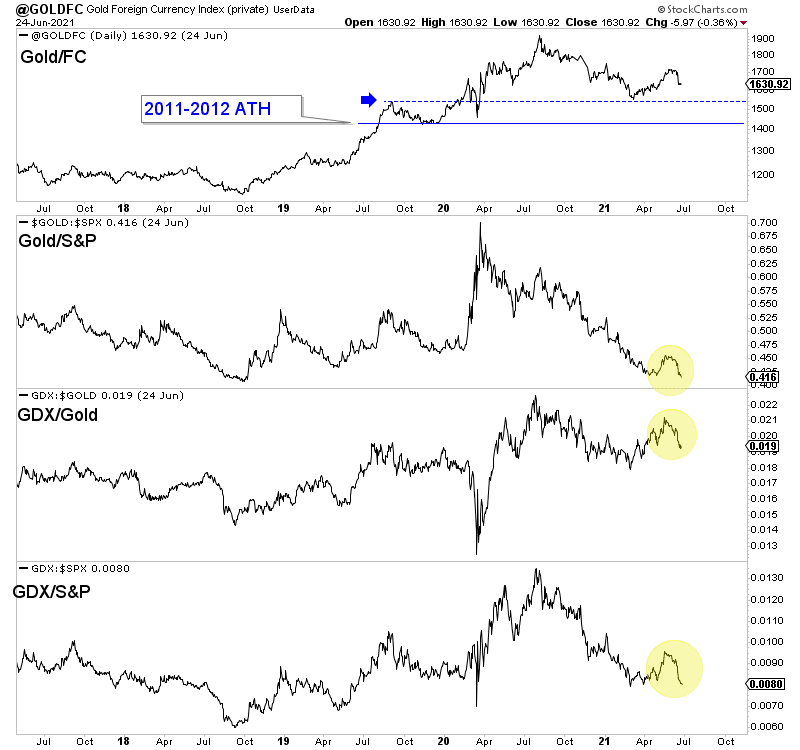
No divergences yet in leading indicators
Because the resumption of the larger correction is only weeks old, it would be too soon to expect any divergences. Nevertheless, the first thing to watch would be if Gold/FC can hold the dashed line support.
In addition to these “leading” indicators, it’s also important to follow sentiment indicators (like the CoT’s) and general support levels, which I will discuss over the weeks ahead.
For individual companies, one should assess their current value and potential value in 18 to 24 months at current and potential future metals prices. Then, consider technical support and levels you can buy that are realistic and provide you enhanced upside potential compared to today.
In my experience, big money is made by buying fundamental quality with upside and holding it for a few years. Trading in and out, while enticing, is dangerous and a good way to underperform over the long run.
I’ve positioned myself in companies with the best combination of upside potential and fundamental quality. These are companies you can buy and hold for a few years that have the potential to be 5,7 and 10 baggers after Gold breaks past $2,100/oz.
Trading in financial instruments and/or cryptocurrencies involves high risks including the risk of losing some, or all, of your investment amount, and may not be suitable for all investors. Prices of cryptocurrencies are extremely volatile and may be affected by external factors such as financial, regulatory or political events. Trading on margin increases the financial risks.
Before deciding to trade in financial instrument or cryptocurrencies you should be fully informed of the risks and costs associated with trading the financial markets, carefully consider your investment objectives, level of experience, and risk appetite, and seek professional advice where needed.
Fusion Media would like to remind you that the data contained in this website is not necessarily real-time nor accurate. The data and prices on the website are not necessarily provided by any market or exchange, but may be provided by market makers, and so prices may not be accurate and may differ from the actual price at any given market, meaning prices are indicative and not appropriate for trading purposes. Fusion Media and any provider of the data contained in this website will not accept liability for any loss or damage as a result of your trading, or your reliance on the information contained within this website.
It is prohibited to use, store, reproduce, display, modify, transmit or distribute the data contained in this website without the explicit prior written permission of Fusion Media and/or the data provider. All intellectual property rights are reserved by the providers and/or the exchange providing the data contained in this website.
Fusion Media may be compensated by the advertisers that appear on the website, based on your interaction with the advertisements or advertisers.