Gold’s Breakdown Hints At A Major Top
Faraday Research | Apr 16, 2019 01:15PM ET
As any gold bug will tell you, last year’s fourth quarter was a strong one, with the yellow metal gaining nearly 8% from October through New Year’s Day. The good times carried over into mid-February, when gold peaked near $1350, but the price action over the last two months suggests that a major top may have formed.
As the chart below shows, the first quarter’s price action formed a large “rounded top” (or a modified head-and-shoulders pattern). This pattern was preceded by a triple bearish divergence in both the RSI and MACD indicators, a clear sign that bullish momentum was waning through January and early February; now both indicators are in bearish territory.
With Monday's 1%+ drop, the yellow metal is breaking to new year-to-date lows below the “neckline” of that pattern near $1275. A confirmed breakdown would project a “measured move” objective just above the $1200 level, with additional support near the October lows at 1181:
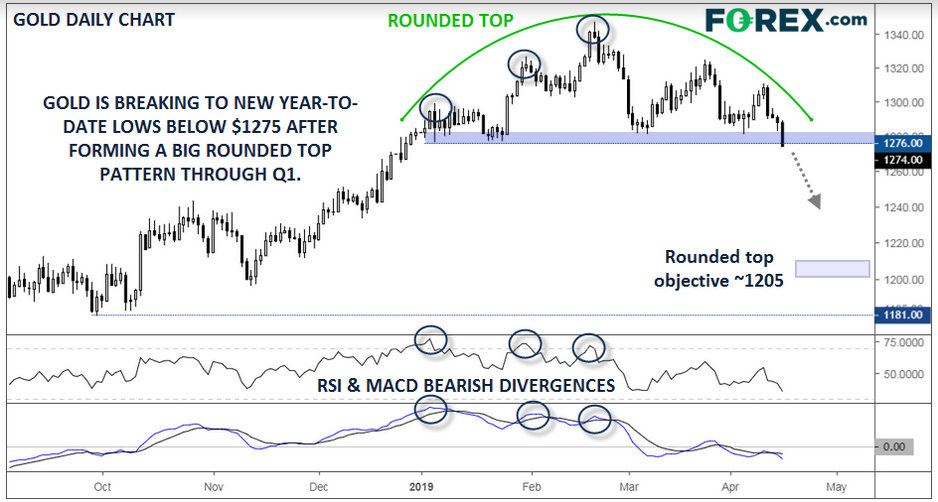
Source: TradingView, FOREX.com
From a fundamental perspective, the global shift toward easier monetary policy should act to support gold, though to the extent it’s driven by fears of an economic slowdown, it may be partially offset by decreasing demand for gold jewelry. As always, real interest rates continue to have an inverse relationship with gold, so continued signs of a slowdown in global inflationary pressures would help confirm the bearish technical picture.
Cheers,

Trading in financial instruments and/or cryptocurrencies involves high risks including the risk of losing some, or all, of your investment amount, and may not be suitable for all investors. Prices of cryptocurrencies are extremely volatile and may be affected by external factors such as financial, regulatory or political events. Trading on margin increases the financial risks.
Before deciding to trade in financial instrument or cryptocurrencies you should be fully informed of the risks and costs associated with trading the financial markets, carefully consider your investment objectives, level of experience, and risk appetite, and seek professional advice where needed.
Fusion Media would like to remind you that the data contained in this website is not necessarily real-time nor accurate. The data and prices on the website are not necessarily provided by any market or exchange, but may be provided by market makers, and so prices may not be accurate and may differ from the actual price at any given market, meaning prices are indicative and not appropriate for trading purposes. Fusion Media and any provider of the data contained in this website will not accept liability for any loss or damage as a result of your trading, or your reliance on the information contained within this website.
It is prohibited to use, store, reproduce, display, modify, transmit or distribute the data contained in this website without the explicit prior written permission of Fusion Media and/or the data provider. All intellectual property rights are reserved by the providers and/or the exchange providing the data contained in this website.
Fusion Media may be compensated by the advertisers that appear on the website, based on your interaction with the advertisements or advertisers.