Gold, Silver “Washout” – Get Ready For A Big Move Higher
Chris Vermeulen | Jun 03, 2020 03:34PM ET
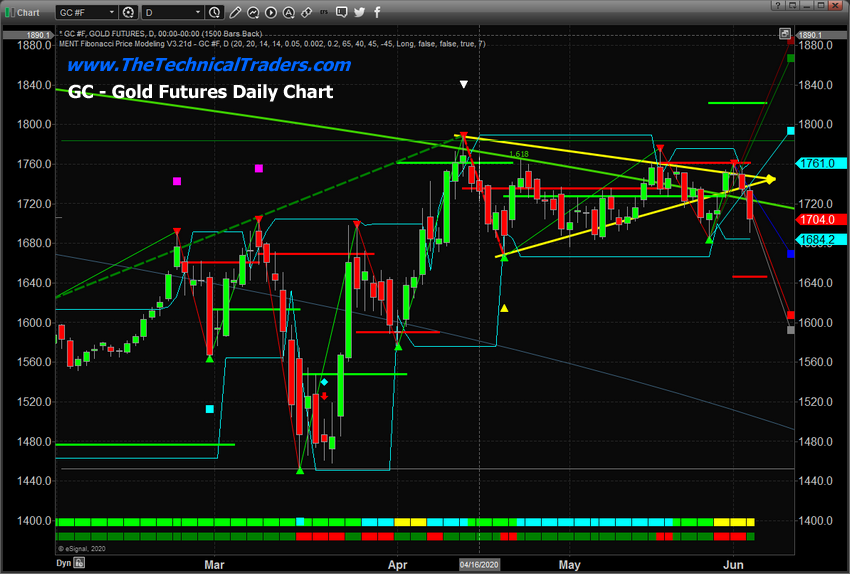
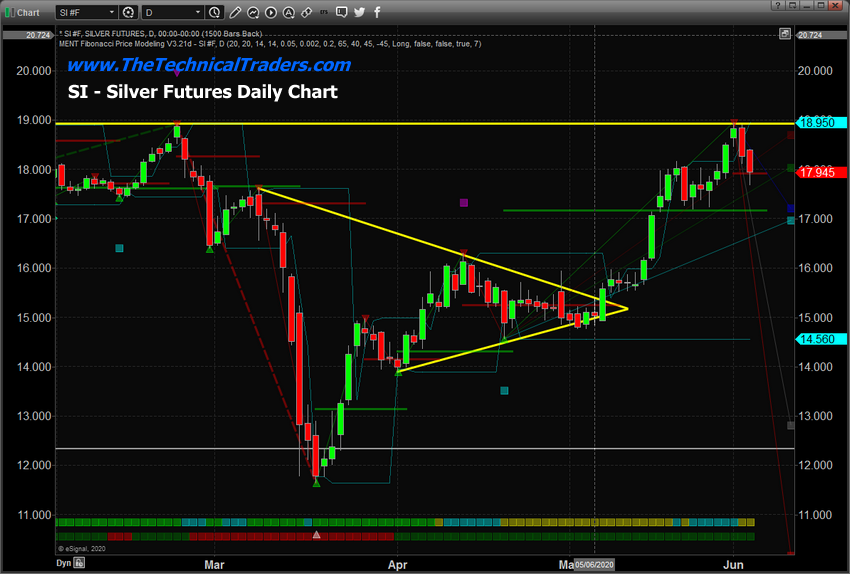
Gold and silver moved lower early on June 2 and June 3. Our research team believes this is a “washout low” price rotation following a technical pattern that will prompt a much higher rally in precious metals. This type of washout price rotation is fairly common before very big moves after Pennant/Flag formations or just after reaching major price trigger levels.
With gold, a sideways Pennant/Flag formation has been setting up near our GREEN Fibonacci Price Amplitude Resistance Arc. We believe the downward price rotation recently is a perfect setup for skilled technical traders to take advantage of lower entry price levels. The GREEN Fibonacci Price Amplitude Arc will very likely be breached over the next five to 10 trading days and the price of gold should rally well above $1,850 in the process. We believe this washout rotation is a process of running through the Long Stops just below recent price activity that will end with a defined upside price rally over the next 2 to 5+ weeks.

Silver has set up a completely different type of price pattern – a true Double-Top pattern. The downward price rotation recently in silver is indicative of a weaker reaction to this massive resistance pattern and double-top. The likelihood that silver will find support above $17 and mount a further upside price rally over the next 2 to 5+ weeks is still very strong. After the deep downward price collapse in silver took place, just like what happened in 2009 and 2010, the upside potential for silver is still massive – likely targeting $65 per ounce of higher.

This current gold-to-silver ratio monthly chart highlights the recent collapse in the ratio level as silver rallied from near $12 towards current levels near $18. A similar spike in the gold-to-silver ratio took place in 2008-09 – just before the broader market collapse in the U.S .and global markets took place. This happens as the initial reaction to risk in the global markets pushes gold prices a bit higher while, silver, the often overlooked store of value, typically declines in value.
Once the price of silver starts to rally, pushing the gold to silver ratio below 60 typically, both gold and silver start to align in price and begin to rally together. The current level of the gold-to-silver ratio
is 94.9. This suggests that both gold and silver have quite a way to go in terms of reaching the “alignment phase.” Our researchers believe gold will rally above $2,100 to $2,400 and silver will rally above $40 to $50 before the two metals align and begin to rally together in almost equal strength.
Concluding Thoughts:
Pay attention to what happens to precious metals over the next 10 to 15+ days. If our research is correct, both gold and silver will rally higher by about 7.5% to 14% - setting up new price highs for both metals. When the washout pattern completes, usually a fairly aggressive price trend begins where new price highs are established fairly quickly. Get ready, this should be a really nice upside price swing in precious metals over the next 6+ months or longer.
Trading in financial instruments and/or cryptocurrencies involves high risks including the risk of losing some, or all, of your investment amount, and may not be suitable for all investors. Prices of cryptocurrencies are extremely volatile and may be affected by external factors such as financial, regulatory or political events. Trading on margin increases the financial risks.
Before deciding to trade in financial instrument or cryptocurrencies you should be fully informed of the risks and costs associated with trading the financial markets, carefully consider your investment objectives, level of experience, and risk appetite, and seek professional advice where needed.
Fusion Media would like to remind you that the data contained in this website is not necessarily real-time nor accurate. The data and prices on the website are not necessarily provided by any market or exchange, but may be provided by market makers, and so prices may not be accurate and may differ from the actual price at any given market, meaning prices are indicative and not appropriate for trading purposes. Fusion Media and any provider of the data contained in this website will not accept liability for any loss or damage as a result of your trading, or your reliance on the information contained within this website.
It is prohibited to use, store, reproduce, display, modify, transmit or distribute the data contained in this website without the explicit prior written permission of Fusion Media and/or the data provider. All intellectual property rights are reserved by the providers and/or the exchange providing the data contained in this website.
Fusion Media may be compensated by the advertisers that appear on the website, based on your interaction with the advertisements or advertisers.