Gold May Be Due A Correction But Bears Might Get The Last Laugh
Faraday Research | Jun 22, 2018 06:25AM ET
In response to our prior Gold analysis, the shiny yellow metal’s trendline folded and a decisive break of $1300 ensued. But since finding support around $1260, can the bears take it to fresh lows?
The gold daily chart clearly shows the magnitude of the bearish break out from compression which had, up until that point, provided a coiling formation between its December 2016 trendline and 200-day average. Overall the average had capped well as resistance, although it is a bearish hammer which marked a final bullish push before prices rolled over like a bearish boss.
With the hammer providing a prominent swing high, a bearish channel can now be identified. And as bearish momentum on this leg lower has intensified, we fancy its chances of eventually breaking lower.
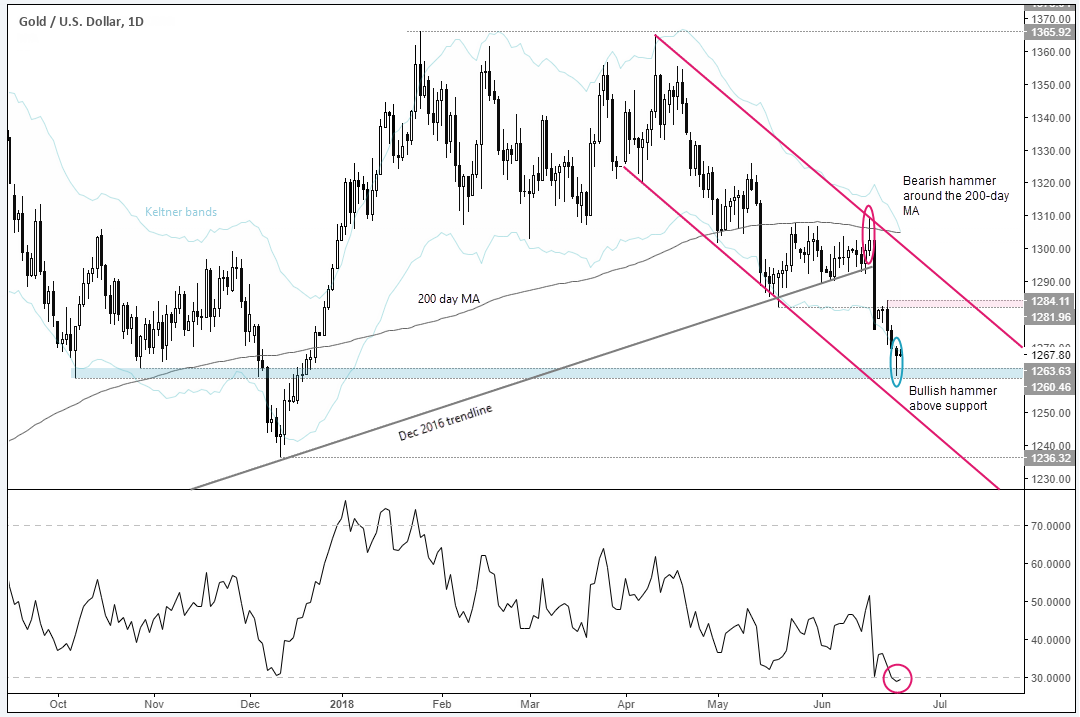
Still, prices have since found support around the 1260.46-1263.63 support zone and recent price action is sending smoke signals for a potential correction. The lower wick of yesterday’s bullish hammer has respected the support zone which also appears to be over extended relative to its lower Keltner band, whilst RSI is also oversold. All of that, combined with the bearish outside day on the US dollar index means the potential for a bounce higher from here should not be overlooked.
Original post

Trading in financial instruments and/or cryptocurrencies involves high risks including the risk of losing some, or all, of your investment amount, and may not be suitable for all investors. Prices of cryptocurrencies are extremely volatile and may be affected by external factors such as financial, regulatory or political events. Trading on margin increases the financial risks.
Before deciding to trade in financial instrument or cryptocurrencies you should be fully informed of the risks and costs associated with trading the financial markets, carefully consider your investment objectives, level of experience, and risk appetite, and seek professional advice where needed.
Fusion Media would like to remind you that the data contained in this website is not necessarily real-time nor accurate. The data and prices on the website are not necessarily provided by any market or exchange, but may be provided by market makers, and so prices may not be accurate and may differ from the actual price at any given market, meaning prices are indicative and not appropriate for trading purposes. Fusion Media and any provider of the data contained in this website will not accept liability for any loss or damage as a result of your trading, or your reliance on the information contained within this website.
It is prohibited to use, store, reproduce, display, modify, transmit or distribute the data contained in this website without the explicit prior written permission of Fusion Media and/or the data provider. All intellectual property rights are reserved by the providers and/or the exchange providing the data contained in this website.
Fusion Media may be compensated by the advertisers that appear on the website, based on your interaction with the advertisements or advertisers.