Gold Is Half Of What The S&P Is Double
Mark Mead Baillie | Jan 12, 2015 01:33AM ET
Basis "traditional" valuation, that is, under rational conditions. And whilst irrationality trumps solvency if one remains stubbornly rational -- for axiomatically "the markets are never wrong" -- as history has demonstrated time and again, rational valuation will out. 'Tis just that en route in returning to rationality, you don't desire your dough to have first run out.
Today's algorithmically-driven markets lack conception of rational valuation. At the rudimentary trading level, as more offers are hit than are bids, markets rise, else vice-versa, fundamental and technical arguments/extremes be damned. And to the extent our witnessing through these recent years rational valuation having been hoovered away in its entirety, be it by Gold's diving or the S&P's soaring, 'tis the absolute function of trend being herded farther and farther in the same direction as "everybody does what everybody else is doing", (and yes, every market unit traded requires both a buyer and a seller, but as they say, "size matters").
Still, valuations can become so extreme that regressing back to some calculation of mean essentially becomes meaningless. Or to exaggeratively make the point, vertical markets, be they straight up or straight down, have no mean. Yet when the catalyst arrives that suddenly, and as history has shown, violently, puts ridiculously valued markets swiftly back into their place, the consequences upon the herd are punishingly mean.
Which in turn is why 'tis quipped on occasion that, save for a rare few, "nobody really makes any money from Wall Street". Not helping was the S&P's correcting by better than -50% from March 2000 to October 2002. Neither helpful was the S&P's again correcting by better than -50% from October 2007 to March 2009. Nor shall the next -50% correction help. Just this past October, survey results from a noteworthy investment bank suggested that the average non-affluent retirement account savings amounted to only $29,358. That's hopeless. The average amount for affluent investors came in at $342,592. Invest that in the 10-year U.S. Treasury Note at the current yield of 1.971% for annualized interest of $6,752, which along with your Social Security, some pension income and a subway token, and that's about it for your Golden Years. "Sorry dear, I know it's my 80th birthday, but I still have to go to work." Got Gold?
Here's the point: This first full trading week of this year was indicative of reverting to rationality. That is not so much a figment of our imagination, but rather a filament of illumination that for the first time in a long time may finally be spreading its light across the investing and trading spectrum that Gold, by golly, really is valued at half what it ought be, whilst the S&P 500, we dread, is valued at double what it ought be. Simply stated: Gold is today at 1223, the innocent rationality of the above scoreboard doubling the current value to 2463; the S&P today is at 2045, the innocent rationality of its honestly-calculated price/earnings ratio (29.3x) halving its current value to 1023 (a p/e then of 14.7x being far more historically in line).
But to have followed such logic through recent years of being Long Gold and Short the S&P would today find you without a pot into which to peer into your future. Again, neither market is "wrong", for 'tis where the trade mechanism has placed them. Moreover, most have not missed the move, given "everybody" being in the S&P and "nobody" in Gold.
The key, of course, is to be wary and have an action plan for when, as we like to say, it again all goes wrong upon the next round of irrationality reverting to rationality. And given the way 2015 has commenced, with Gold duly on the rise and the S&P acting as if a serpent in the whiplashing throes of death, this could be that year. To wit, the following chart of the S&P paints quite the picture. Each vertical bar represents the first six trading days of all 16 years from 2000 through yesterday's (Friday's) sixth trading day of 2015; the height of each bar is -- for the first six days of its respective year -- the summation of each day's percentage trading range; the green line is the S&P 500, (the red dots being the Index's level six days into each year). Look what the S&P has done when prior bars have neared the 8% or higher level, as is now the rightmost case for 2015:
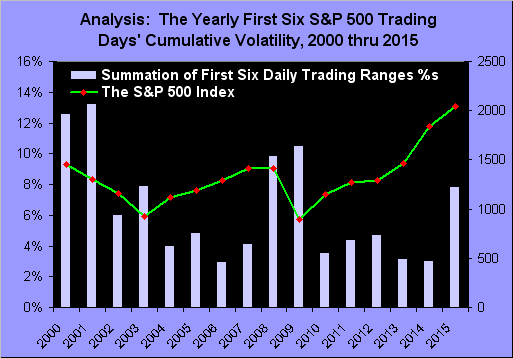
"Jeepers, mmb, that certainly doesn't seem to bode well for the stock market going forward..."
'Tis the inference, Squire. And the nature of the ramped-up volatility through these first six trading days of 2015 appears borne of man's battling against his own algorithms in an effort to weather the assaults on his wherewithal. Yet, in spite of all the ado over the stock market's volatility, when viewing its track across the last 21 years, what we're seeing today is nothing, the rightmost wee, wrinkly hook below being December through January, as scrutinized by our two friends:
One more S&P-related chart and then we'll go with Gold through missive's end. Below we've the Economic Barometer alongside the S&P from a year ago-to-date. The Econ Baro's current "down-kink" appears similar to those prior across the chart, so much so that should this "rhythm" of the economy continue, we'd expect the Baro's beginning to bend back up as imminent. But when we itemize those economic data points that have contributed to the Baro's most recent weakness, the picture may instead turn more dire. The Baro's negative metrics since mid-December include: the New York Empire State Index, the NAHB Housing Index, Housing Starts, Building Permits, the CPI, the Current Account, the Philly Fed Index, Existing Home Sales, Durable Orders, Michigan’s Sentiment Survey, PCE Inflation, New Home Sales, the Chicago PMI, the ISM Index & Services Index, Construction Spending, Auto & Truck Sales, Consumer Credit, Non-farm Payrolls and Hourly Earnings:
And the Federal Open Market Committee is still assessing a rate hike? Really? 'Twill be fascinating to watch how that notion instead morphs toward a Quantitative Easing IV.
Redounding positively for Gold, quite naturally, would be a QE IV on the heels of European Community Bank €uro printing, which of its own accord is widely expected as being right 'round the bend. To the extent that such logic is working its way back into Gold, it indeed closed out its first full trading week for the year with a +3% gain, the parabolic Long trend as denoted below by the blue dots nicely intact, as we see here:
In fact from our technical purview, the best thing that happened to Gold this past week was our near-term Market Rhythm Target for 1164.1 getting nixed, as the daily Price Oscillator study flipped from negative to positive. Imagine that: a Gold Short signal that actually failed! Pinch me, for I must be dreaming. But there 'tis below in the daily bars, as red has just turned to green:
Nevertheless, Gold is presently is a bit high vis-à-vis its smooth, pearly line, wherein near-term value is derived from how price is moving relative to same of the primary markets that comprise BEGOS, (Bond / Euro / Gold / Oil / S&P). But we'd prefer the smooth line play "catch-up" to Gold, rather than vice-versa, such that when they next meet, price shall be higher still:
Within the context of Gold's tide becoming more positive, (not to mention price most broadly being grossly undervalued by half as described by the Scoreboard), we remain tempered per last week's missive about just how robust a year Gold may have. To reiterate, were Gold to put in an "average" year based on the past 14, 'twould conclude 2015 at 1329; to repeat its best year of the past 14, 'twould conclude 2015 at 1554. But to complete 2015 anywhere within that 1329-1554 range would be a large step forward along Gold's long road to recovery.
This week's final graphic is of near-term trend consistency and profile. On the left, Gold's "Baby Blues" are back on the rise, the positive there being that the blue dots never made it back down to their lower -80% horizontal axis: that is exemplary of BuySide reinforcement. On the right, Gold's 10-day Market Profile puts price at the top of that trading range, its most dominant trading support level now being 1212. How grand 'twould be to finally be finished with the 1100s!
In sum, we view the first full trading week of 2015 as having pointed to a significant sea change for both half-valued Gold and the double-valued S&P, indeed what in a year's time may be looked back upon as a classic inflection point for these and other major markets. The yield on the US 30 Year T-Bond -- 2.556% -- is at all but its lowest level for at least as far back as our broadcast data provides (to 1993 when the yield was over 6%). The double-valued stock market is clearly starting to get strangled. Yet through it all, Gold, whose usage as money dates back to the fourth millennium BC, is still around: rare, weighty, brilliant, and again, undervalued by half, assuming mathematics remain an accepted science. Thus as we like to say: "Hang onto your Gold!"
Allow me this note in closing: we oft herein make light of our beloved France, its governmental and financial foibles regularly setting them up for a pun or two. Given the horrific acts in recent days, our sentiments go out to friends and family there, and we embrace with pride the nation's solidarity. France is the country that perennially sets the bar high in cultural innovation, artistic fire and culinary delight all within a modernization of infrastructure and an emphasis on the joy of life. Freedom of expression is France. May it always be so.
Trading in financial instruments and/or cryptocurrencies involves high risks including the risk of losing some, or all, of your investment amount, and may not be suitable for all investors. Prices of cryptocurrencies are extremely volatile and may be affected by external factors such as financial, regulatory or political events. Trading on margin increases the financial risks.
Before deciding to trade in financial instrument or cryptocurrencies you should be fully informed of the risks and costs associated with trading the financial markets, carefully consider your investment objectives, level of experience, and risk appetite, and seek professional advice where needed.
Fusion Media would like to remind you that the data contained in this website is not necessarily real-time nor accurate. The data and prices on the website are not necessarily provided by any market or exchange, but may be provided by market makers, and so prices may not be accurate and may differ from the actual price at any given market, meaning prices are indicative and not appropriate for trading purposes. Fusion Media and any provider of the data contained in this website will not accept liability for any loss or damage as a result of your trading, or your reliance on the information contained within this website.
It is prohibited to use, store, reproduce, display, modify, transmit or distribute the data contained in this website without the explicit prior written permission of Fusion Media and/or the data provider. All intellectual property rights are reserved by the providers and/or the exchange providing the data contained in this website.
Fusion Media may be compensated by the advertisers that appear on the website, based on your interaction with the advertisements or advertisers.