Gold Indicator Facing Long-Term Breakout Level
Chris Kimble | Aug 29, 2019 04:33PM ET
Gold/Metals bulls want to pay attention to how this indicator handles a current breakout test.
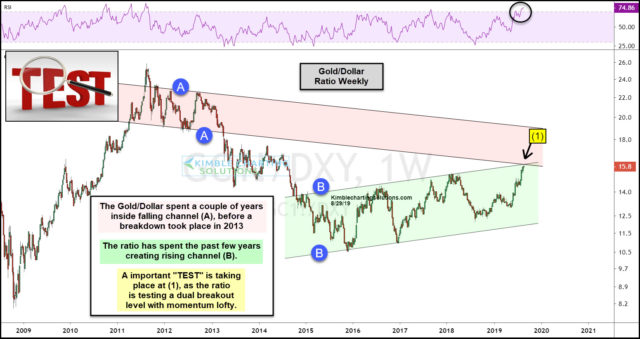
This chart looks at the Gold:Dollar ratio on a weekly basis over the past decade.
The ratio created a falling channel (A) from 2011 to 2013. Once support broke, gold continued to be much weaker than the US dollar for a few years.
The ratio started creating a rising channel (B) in 2016/2017, as higher lows started forming. These higher lows reflected that gold was outperforming USD.
The rally over the past couple of years has the ratio testing the top of rising channel (B) and the underside of falling channel (A) at (1).
It appears that a very important long-term breakout test is in play, with momentum at the highest level in 8 years.
How the ratio handles this breakout test will send gold and silver a very important long-term message.
![]()
Trading in financial instruments and/or cryptocurrencies involves high risks including the risk of losing some, or all, of your investment amount, and may not be suitable for all investors. Prices of cryptocurrencies are extremely volatile and may be affected by external factors such as financial, regulatory or political events. Trading on margin increases the financial risks.
Before deciding to trade in financial instrument or cryptocurrencies you should be fully informed of the risks and costs associated with trading the financial markets, carefully consider your investment objectives, level of experience, and risk appetite, and seek professional advice where needed.
Fusion Media would like to remind you that the data contained in this website is not necessarily real-time nor accurate. The data and prices on the website are not necessarily provided by any market or exchange, but may be provided by market makers, and so prices may not be accurate and may differ from the actual price at any given market, meaning prices are indicative and not appropriate for trading purposes. Fusion Media and any provider of the data contained in this website will not accept liability for any loss or damage as a result of your trading, or your reliance on the information contained within this website.
It is prohibited to use, store, reproduce, display, modify, transmit or distribute the data contained in this website without the explicit prior written permission of Fusion Media and/or the data provider. All intellectual property rights are reserved by the providers and/or the exchange providing the data contained in this website.
Fusion Media may be compensated by the advertisers that appear on the website, based on your interaction with the advertisements or advertisers.