Gold Catches A Trump Tailwind
MarketPulse | Feb 01, 2017 03:45AM ET
It’s been a tough few days for USD bulls as the overriding theme of 2017, the trajectory of US interest rates has been subsumed in a constant stream of White House headlines. The overall effect has been to turn the market into a short-term headline driven beast. For all the noise the overall effect has been for the USD to weaken as the street gets nervous and talk of Trump Reflation and Federal Reserve rate hikes fades away. An excellent summary of last nights sound bites can be found here in my colleague Stephen Innes piece: Shock Rattle and Roll.
These last few days have seen safe-haven buying. Investors have flipped out of equities and into currencies such as yen and NZD. Gold has been the obvious beneficiary as well rallying some $30 an ounce from its lows last week. Gold has another $10 spurt yesterday touching 1215 before Asia has quietly unwound most of it to trade at 1208.50 as we move into the sessions close. This leaves the technical picture quite confused from my commentary last week, where the set-up was quite bearish on the daily charts.
To get a better picture, we need to look at both the hourly and daily charts today.
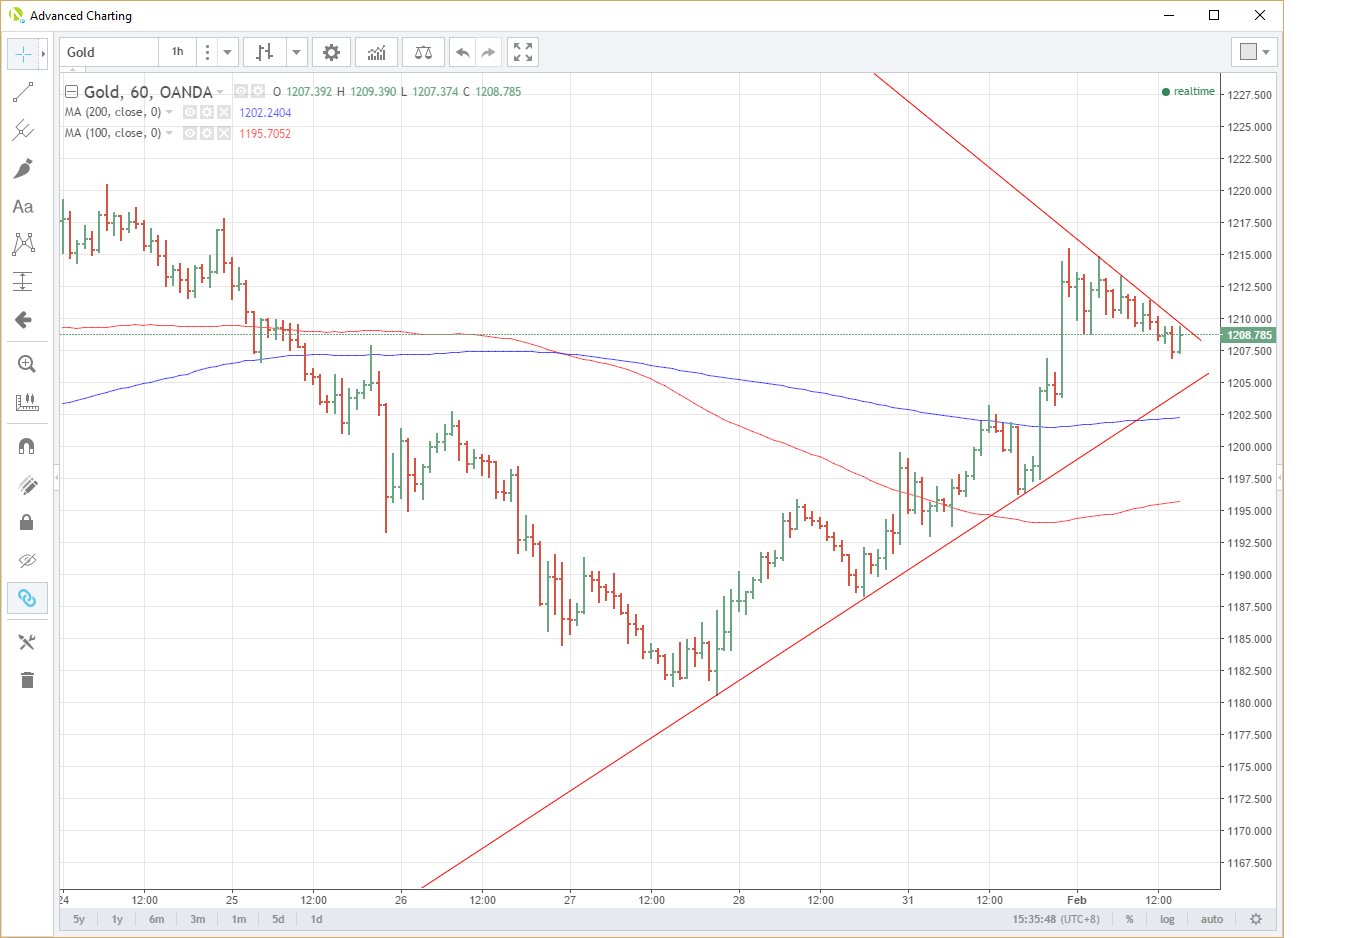
Gold Hourly
If we consider the hourly chart below, we see that gold has been in a very nice little uptrend since its lows of 1180.50. The bottom line of the triangle has held very nicely since January 28th, propelled by the White House-driven tailwind that started blowing over the weekend. Since late New York and into Asia the descending line of the triangle has formed a strong resistance.
How we interpret this can be two ways, firstly gold is making a topping formation, and a break of the support line at 1204 opens up a move all the way back to the 1183 area. Conversely, a break of the resistance line, currently at 1210, implies a technical move higher to 1231. (For clarity I have calculated the triangle’s vertical side as 1197 to 1218, $21).
However, the picture is not that simple as the daily chart is still telling a different story.
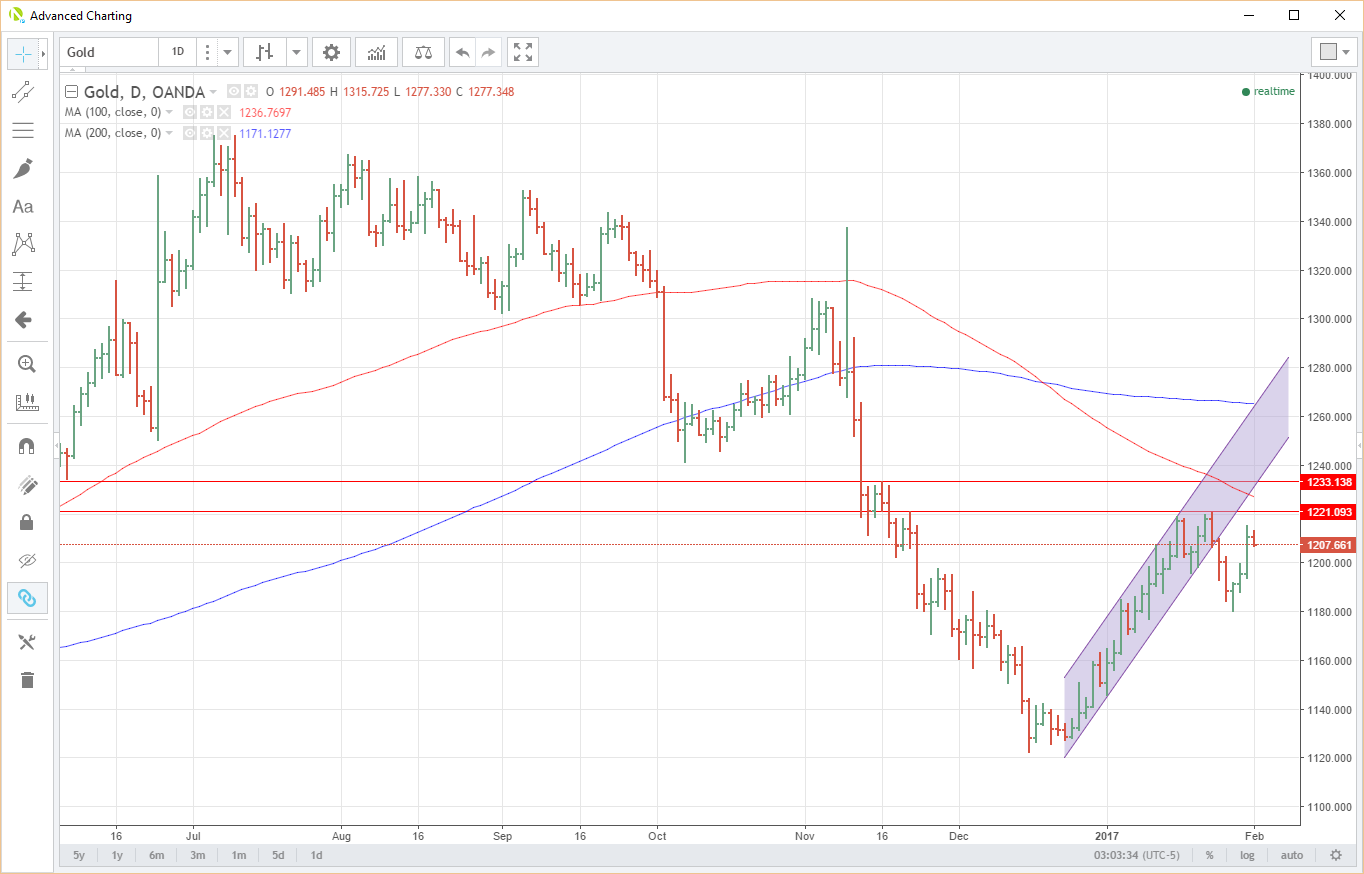
Gold Daily
Despite the $30 rally in gold, the daily picture still has a bearish look to it. As per my commentary late last week, gold has well and truly broken its daily up channel which now becomes resistance. Despite the rally, it is nowhere near the extended base at 1233 today. Importantly, this is also a series of daily tops and a line of horizontal resistance as well.
Ahead of this, we have the 100-day moving average at 1227.25 and most importantly for more short-term traders, resistance at 1221.10. From a technical perspective, this first level at 1221.10 is the most important. Following from the hourly chart above, gold would walk into this level soon after a breakout of the hourly triangle. Gold has also failed in this general region numerous times since mid-November.
Support is not evident until the daily low of a few days ago around the 1180 area.
The Trumper-tantrums of the last five days has seen gold make a storming comeback as the USD weakens and investors seek safe havens. The short-term and longer-term charts post contrasting technical pictures. My best interpretation would be gold has the potential to break higher in the short-term but would almost immediately run into some serious longer term resistance. With the FOMC this evening and Non-Farm Payrolls (NFP) Friday, I certainly wouldn’t blame investors looking for a “haven” for now.
Should gold break lower on the short-term charts, this would reinforce the more bearish technical picture I have been describing longer-term. If we digress from technicals for a moment, a hawkish FOMC statement, a good NFP, clarity on the Trump reflation policies could all see USD strength return with a vengeance and rather quickly so. That said, it would be a brave man who bet against more White House headline bombs either!
Original post
Trading in financial instruments and/or cryptocurrencies involves high risks including the risk of losing some, or all, of your investment amount, and may not be suitable for all investors. Prices of cryptocurrencies are extremely volatile and may be affected by external factors such as financial, regulatory or political events. Trading on margin increases the financial risks.
Before deciding to trade in financial instrument or cryptocurrencies you should be fully informed of the risks and costs associated with trading the financial markets, carefully consider your investment objectives, level of experience, and risk appetite, and seek professional advice where needed.
Fusion Media would like to remind you that the data contained in this website is not necessarily real-time nor accurate. The data and prices on the website are not necessarily provided by any market or exchange, but may be provided by market makers, and so prices may not be accurate and may differ from the actual price at any given market, meaning prices are indicative and not appropriate for trading purposes. Fusion Media and any provider of the data contained in this website will not accept liability for any loss or damage as a result of your trading, or your reliance on the information contained within this website.
It is prohibited to use, store, reproduce, display, modify, transmit or distribute the data contained in this website without the explicit prior written permission of Fusion Media and/or the data provider. All intellectual property rights are reserved by the providers and/or the exchange providing the data contained in this website.
Fusion Media may be compensated by the advertisers that appear on the website, based on your interaction with the advertisements or advertisers.