Gold Breaking Down, But Multiple Non-Confirmations
Jordan Roy-Byrne, CMT | Sep 21, 2022 03:22AM ET
Gold is breaking down technically. There’s no denying it.
Gold has already closed at a fresh 52-week and 2-year low in daily and weekly terms. It needs to close above $1715 at the end of the month to negate a monthly breakdown.
However, recent weakness has not been confirmed by similar markets.
Gold has made a lower low in September. The miners have not. Silver is up 7% this month, while gold has lost 3%.
Most importantly, unlike in 2013 (and few have looked beyond the nominal chart), gold has yet to make a new low against the stock market.
In our most recent article, we wrote about how gold stocks look their worst at major bottoms, and we showed how the gold to S&P 500 ratio had already bottomed or was making higher highs at each gold bottom.
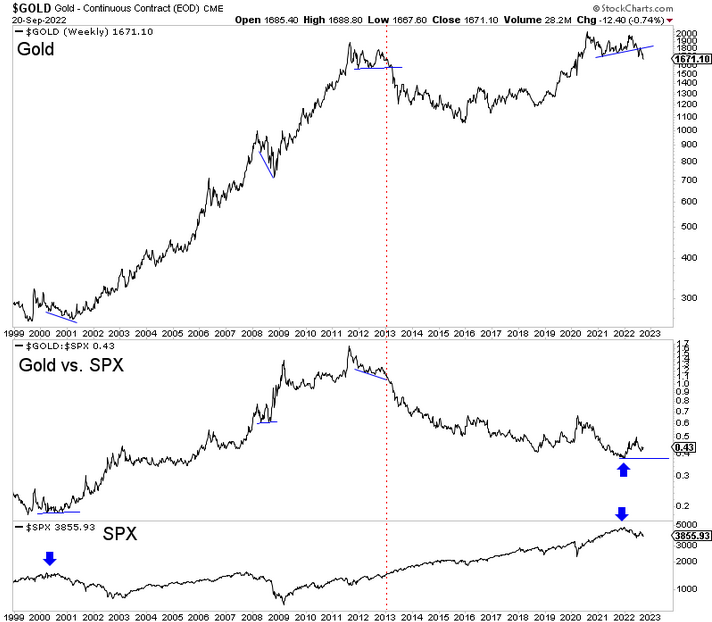
In the chart below, we plot gold, the gold to S&P 500 ratio, and the S&P 500.
Note the positive divergence in the gold to S&P 500 ratio at the time of the 2001 and 2008 bottoms. Compare them to 2013, when the gold to S&P 500 ratio made lower lows in 2012 and began to crash in early 2013 before gold lost support at $1550.
Furthermore, note that the bottom in the gold to S&P 500 ratio in 2000 and presumed bottom at the tail end of 2021 coincided with major market peaks (blue arrows). Moreover, from mid-2012 through 2013, the S&P 500 did not even correct more than 9%!
With all that said, we must consider the entire context.
Gold is breaking down technically, and unless there is a big upside reversal into October, the path of least resistance is lower, and gold can drop another $100/oz from here.
The likelihood of a recession, lower lows in the stock market, and the end of Fed tightening will lead to a major bottom in precious metals and a huge move higher into and in 2023.
Gold can move lower before that happens but, one must note that there are some non-confirmations now and, positioning is skewed heavily towards more tightening and lower metals prices. Any blip of bad news on the economy or small unwinding of those positions can create a big rebound.
Trading in financial instruments and/or cryptocurrencies involves high risks including the risk of losing some, or all, of your investment amount, and may not be suitable for all investors. Prices of cryptocurrencies are extremely volatile and may be affected by external factors such as financial, regulatory or political events. Trading on margin increases the financial risks.
Before deciding to trade in financial instrument or cryptocurrencies you should be fully informed of the risks and costs associated with trading the financial markets, carefully consider your investment objectives, level of experience, and risk appetite, and seek professional advice where needed.
Fusion Media would like to remind you that the data contained in this website is not necessarily real-time nor accurate. The data and prices on the website are not necessarily provided by any market or exchange, but may be provided by market makers, and so prices may not be accurate and may differ from the actual price at any given market, meaning prices are indicative and not appropriate for trading purposes. Fusion Media and any provider of the data contained in this website will not accept liability for any loss or damage as a result of your trading, or your reliance on the information contained within this website.
It is prohibited to use, store, reproduce, display, modify, transmit or distribute the data contained in this website without the explicit prior written permission of Fusion Media and/or the data provider. All intellectual property rights are reserved by the providers and/or the exchange providing the data contained in this website.
Fusion Media may be compensated by the advertisers that appear on the website, based on your interaction with the advertisements or advertisers.