Gold And Inflation Expectations
Steve Saville | Jul 08, 2019 01:09AM ET
Gold tends to perform well relative to commodities in general when inflation expectations are FALLING. The evidence is presented below in chart form.
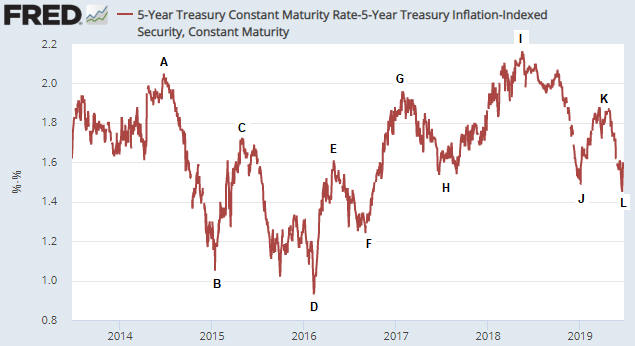
The first of the following charts show the Expected CPI, which in this case is determined by subtracting the yield on the 5-year TIPS (Treasury Inflation Protected Security) from the yield on the 5-year T-Note. In effect, the chart shows the average annual “inflation” rate that the market expects the US government to report over the next 5 years. We’ve labeled all of the important highs and lows on this chart.
The second of the following charts show the gold/commodity ratio (the US$ gold price divided by the GSCI Spot Commodity Index). The labels on this chart correspond to the labels on the first chart. For example, point A on the first chart is the same time as point A on the second chart.
Notice that in every case over the 6-year period covered by the following charts, a high for inflation expectations (the Expected CPI) is associated with a low for the gold/commodity ratio and a low for inflation expectations is associated with a high for the gold/commodity ratio.
The relationship we tried to show above is more clearly demonstrated by the next chart. On this chart, the commodity/gold ratio (as opposed to the gold/commodity ratio) is compared to the ProShares Inflation Expectations ETF (RINF). The correlation clearly is strong, with commodities consistently outperforming gold when inflation expectations are rising and underperforming gold when inflation expectations are falling.
An implication of the above charts is that if inflation expectations are close to an intermediate-term bottom then the financial world is close to the start of a 6-12 month period during which the industrial metals perform better than gold. Alternatively, a further decline in inflation expectations (increasing fear of deflation) would lead to additional relative strength in gold.
We realize that the above message is the opposite of what most people believe about gold, but a lot of what most people believe about gold is not accurate. Of particular relevance to this discussion, gold has never been a hedge against “price inflation”.
Gold tends to perform relatively well during periods when financial-system and/or economic confidence is on the decline. The declining confidence sometimes will go hand-in-hand with rapid “price inflation”, but it isn’t reasonable to expect gold to be a useful hedge against what generally is considered these days to be normal “inflation”. In fact, part of the reason for the strong INVERSE relationship between the gold/commodity ratio and inflation expectations is the general view that “inflation” of 2%-3% is beneficial.
Our view is that the next three months could be dicey, especially if there’s another sharp decline in the stock market. However, we think that by the end of this year inflation expectations will be significantly higher and industrial metals such as copper and platinum will be significantly more expensive relative to gold.
Trading in financial instruments and/or cryptocurrencies involves high risks including the risk of losing some, or all, of your investment amount, and may not be suitable for all investors. Prices of cryptocurrencies are extremely volatile and may be affected by external factors such as financial, regulatory or political events. Trading on margin increases the financial risks.
Before deciding to trade in financial instrument or cryptocurrencies you should be fully informed of the risks and costs associated with trading the financial markets, carefully consider your investment objectives, level of experience, and risk appetite, and seek professional advice where needed.
Fusion Media would like to remind you that the data contained in this website is not necessarily real-time nor accurate. The data and prices on the website are not necessarily provided by any market or exchange, but may be provided by market makers, and so prices may not be accurate and may differ from the actual price at any given market, meaning prices are indicative and not appropriate for trading purposes. Fusion Media and any provider of the data contained in this website will not accept liability for any loss or damage as a result of your trading, or your reliance on the information contained within this website.
It is prohibited to use, store, reproduce, display, modify, transmit or distribute the data contained in this website without the explicit prior written permission of Fusion Media and/or the data provider. All intellectual property rights are reserved by the providers and/or the exchange providing the data contained in this website.
Fusion Media may be compensated by the advertisers that appear on the website, based on your interaction with the advertisements or advertisers.