Gold: A Unique Repeat Of 2007 And How To Profit
Chris Vermeulen | Apr 19, 2018 12:42AM ET
Since Spring is in the air here are some colorful charts and show you where we feel the price of gold and stocks are within the current market cycles.
Below are monthly charts of the S&P 500 and the price of gold. The first chart shows a pattern that gold formed just before stocks hit all-time new highs and the bear market started.
The chart is a little noisy, lots of analysis, but we color-coded each area to break it into clear bits size analysis. The chart shows you what happened and what is likely to happen again.
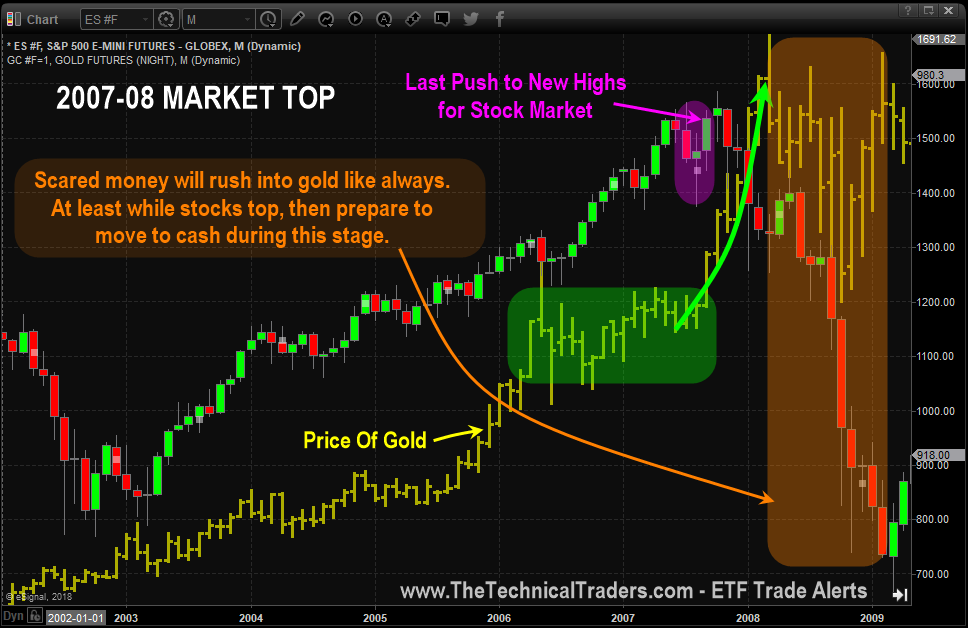
You are here in the stock market
This is the current monthly chart, and if you compare the price action with the above chart, you can’t help but think things are set up in a similar formation as 2007 – 2008.
What does all this mean?
It means, the stock market is nearing a significant top and all everyone’s long-term buy and hold investments should be reviewed and prepared for a rebalancing later this year. Precious metals should do well this year, stocks should top out and for you to preserve their hard-earned money cash is always king for those who don’t actively trade. But if you do trade or you are an active investor huge amounts of money can be made during times of increased volatility, precious metals, and falling stock market prices.
Today’s Stock Market Analysis – Wednesday April 18
What an AWESOME DAY!
All our positions rocketed higher with our most recent entry in SIL (silver miners) leading the way.
We closed our TNA position to lock in 17.7% on the second portion of that trade.
Yes, we do feel the markets will run higher, but we also like to lock in the quick, easy money trades like TNA especially when the overall market is looking and feeling a little top heavy for a day or three.
The chart below of the S&P 500 paints a color picture of what I feel will unfold in the very near term.
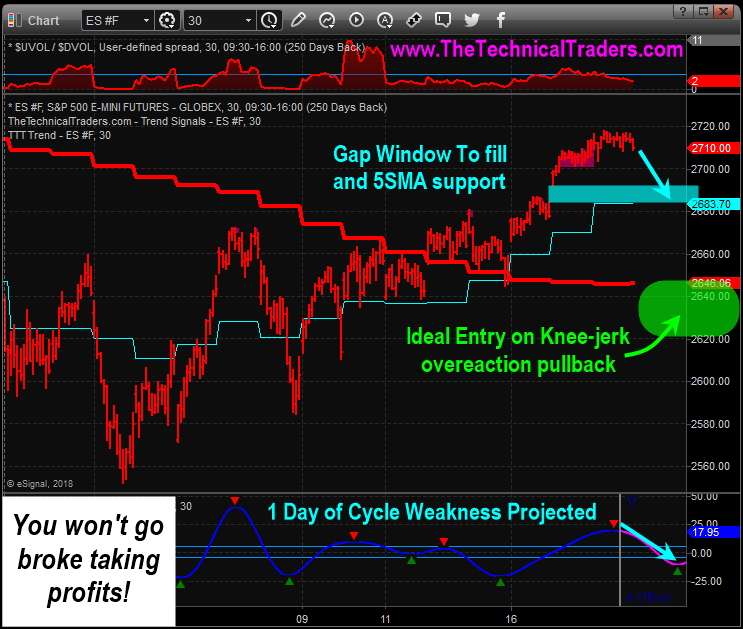
In Conclusion:
Our analysis of the markets was DEAD ON. We called the 2678 level on the ES as a key resistance level to watch before any breakout to the upside would potentially happen. We also called this market bottom nearly three weeks ago on March 28, 2018 and we locked in 17.7% today with our subscribers. We have been nailing these market reversals with incredible accuracy all year and we are just getting started with our Advanced Dynamic Learning systems we have developed.
The bottom line is that smart traders and investors look into the future and position their money where they feel it will increase in value the most. We say this all the time, which is money is continually looking for the best ROI and flows from one asset class to another as the market evolves. With potentially another major financial crisis forming, war, and a bear market in stocks we do not doubt that we are about to experience a huge rebalancing of money over the next few years, and I feel precious metals may be the next little hot pocket for trades.
Trading in financial instruments and/or cryptocurrencies involves high risks including the risk of losing some, or all, of your investment amount, and may not be suitable for all investors. Prices of cryptocurrencies are extremely volatile and may be affected by external factors such as financial, regulatory or political events. Trading on margin increases the financial risks.
Before deciding to trade in financial instrument or cryptocurrencies you should be fully informed of the risks and costs associated with trading the financial markets, carefully consider your investment objectives, level of experience, and risk appetite, and seek professional advice where needed.
Fusion Media would like to remind you that the data contained in this website is not necessarily real-time nor accurate. The data and prices on the website are not necessarily provided by any market or exchange, but may be provided by market makers, and so prices may not be accurate and may differ from the actual price at any given market, meaning prices are indicative and not appropriate for trading purposes. Fusion Media and any provider of the data contained in this website will not accept liability for any loss or damage as a result of your trading, or your reliance on the information contained within this website.
It is prohibited to use, store, reproduce, display, modify, transmit or distribute the data contained in this website without the explicit prior written permission of Fusion Media and/or the data provider. All intellectual property rights are reserved by the providers and/or the exchange providing the data contained in this website.
Fusion Media may be compensated by the advertisers that appear on the website, based on your interaction with the advertisements or advertisers.