Gold's Setting Up For Massive Breakout
Jordan Roy-Byrne, CMT | Jan 18, 2013 10:05AM ET
Last week, we said the following about Gold:
If Gold is able to firm up here and now then it has a good shot to rally back to $1750-$1800 over the next few months. If we get the bullish scenario and a fundamental catalyst shift then expect Gold to break past $1800 in Q3. That would mean that Gold consolidated for two years which would be its longest consolidation on record. The longer the consolidation, the more explosive the breakout.
After that editorial, we noted that various sentiment indicators continued to look favorable even as the market began to make some progress. For example, the daily sentiment index for Gold touched 6%, yet gold didn’t make a new low. At the same time we saw a continued reduction in speculative long positions. Meanwhile, Bloomberg reported that hedge fund long positions in gold were ar their lowest level since August. Take a look at the weekly chart. Gold seemed at risk below $1630 yet it closed above $1650 in each of the past four weeks. Now that it is starting to turn bullish in all time frames -- daily, weekly, monthly -- it has a great chance to rally back to $1750-$1800 over the next few months and to position itself that much closer to a breakout.
That said, we want to show why Gold is setting itself up for an excellent breakout later this year. In the chart below we focus on two things: Price action and volatility as measured by bollinger band width (bottom rows). Have a look.
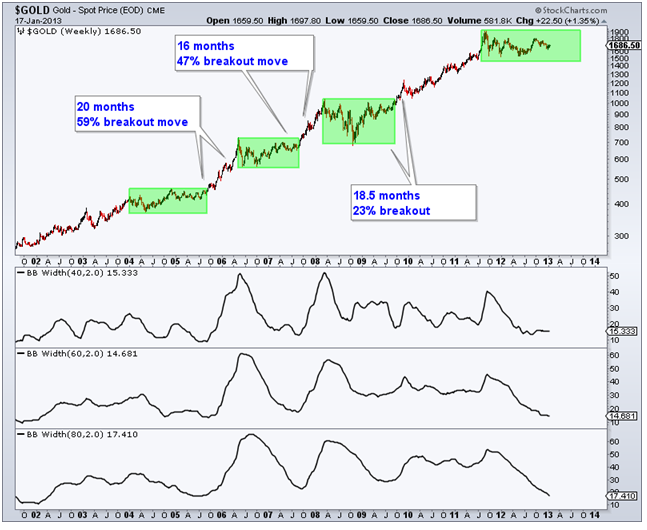
Thus far Gold has experienced three major breakouts and four significant consolidations. The type of breakout depends on the preceding consolidation pattern. The strongest breakouts are born out of consolidations, which are tight in terms of price but long in terms of time. The 2004-2005 consolidation which lasted 20 months, fits that profile. It had the strongest breakout of the three. Meanwhile, the other breakouts weren’t too shabby.
Multi-Year Lows
The current consolidation is most similar to the 2004-2005 consolidation. It is 17 months old and will last two years unless it can blast through $1800 on the next try. Also, its tight range of $1550 to $1800 has remained in place. Furthermore, note the volatility on the various time frames (as measured by bollinger band width). Two of the three readings are at eight-year lows while one is at a five-year low. The last time all readings were at multi-year lows was in 2005.
More Consolidation
Gold does have potential measured targets of $2,050 and $2,250, but in our view those are only initial targets. A target of $2,250 is only a 25% advance. Even a 40% move (less than the first two breakouts) equates to $2,500. This sounds wildly bullish but the technical arguments are there and we are counting on another six to eight months of consolidation before the initial breakout. That consolidation will serve to eliminate any marginally weak hands and replace them with ardent bulls. After a two-year consolidation, those on board would be looking for far more than $2,000 or $2,200.
Before I close, I’d like to note that I will be presenting at the Vancouver Resource Investment Conference on Sunday, January 20, 4:30 pm at the Vancouver convention center west. This is a great opportunity to talk to analysts and companies face to face. This is a critical time in the precious-metals sector. The market remains in consolidation mode, which will continue. Yet, the potential on the other side is vast. There is still time to uncover the stocks poised to be huge winners when and after gold makes its next breakout.
![]()
Trading in financial instruments and/or cryptocurrencies involves high risks including the risk of losing some, or all, of your investment amount, and may not be suitable for all investors. Prices of cryptocurrencies are extremely volatile and may be affected by external factors such as financial, regulatory or political events. Trading on margin increases the financial risks.
Before deciding to trade in financial instrument or cryptocurrencies you should be fully informed of the risks and costs associated with trading the financial markets, carefully consider your investment objectives, level of experience, and risk appetite, and seek professional advice where needed.
Fusion Media would like to remind you that the data contained in this website is not necessarily real-time nor accurate. The data and prices on the website are not necessarily provided by any market or exchange, but may be provided by market makers, and so prices may not be accurate and may differ from the actual price at any given market, meaning prices are indicative and not appropriate for trading purposes. Fusion Media and any provider of the data contained in this website will not accept liability for any loss or damage as a result of your trading, or your reliance on the information contained within this website.
It is prohibited to use, store, reproduce, display, modify, transmit or distribute the data contained in this website without the explicit prior written permission of Fusion Media and/or the data provider. All intellectual property rights are reserved by the providers and/or the exchange providing the data contained in this website.
Fusion Media may be compensated by the advertisers that appear on the website, based on your interaction with the advertisements or advertisers.