Global Stocks Suffer Severe Losses: Where Do We Go From Here?
Mike Zaccardi, CFA, CMT | May 03, 2022 12:52AM ET
This article was first published at TopDown Charts
-
April ended with a huge drubbing for risk assets
-
A sharp rise in global interest rates hurt high-duration stocks the most, but sellers came after some of 2022’s winners too
-
Given a further bearish turn in technicals and several other macro headwinds, we remain cautious on stocks
Global equities were rocked last week by intense selling. There was hardly any place to hide. The S&P 500 lost more than 3% while global stocks ex-US were down a bit less than 2%. Bonds finally caught a few bidders with the US aggregate bond market finishing roughly even during the last week of April.
Tech Stocks At the Epicenter
It was a brutal month for high-duration assets. The US 10-year yield rose from 2.33% to 2.89%. The NASDAQ 100 ETF (NASDAQ:QQQ) plummeted 13.6% to its worst month since late 2008 while the broader US market dropped 9.1%. China, as measured by the iShares China Large-Cap ETF (NYSE:FXI), fell only 3.2% in April, besting both the US aggregate bond market and the global stock market.
Long-Term Upside, but Near-Term Downside
Where do we go from here? We still see major headwinds.
While our bumps up expected returns looking out five to 10 years, the next six to 18 months looks to be a rough stretch. Seasonality is also on the side of the bears through September given that it is a midterm election year in the States (the typical S&P 500 drawdown is 17% during such years). We reiterate a bearish view for the balance of the year on global equities, stocks vs bonds, and on the overall economy.
52-Week Highs Nowhere to be Found
This week’s report underscores risks associated with key issues. An important fallout from April’s dismal global market performance is a worsening technical picture. Recall that stocks bounced strongly off the January and February lows—the S&P 500 actually retraced more than 70% of its early January to February nadir. It wasn’t enough.
Markets failed to make new highs, then global equities took out support. Our featured chart shows just how broad-based the bearish move has been.
Featured Chart: Zero New 52-Week Highs Among 70 Global Stock Markets
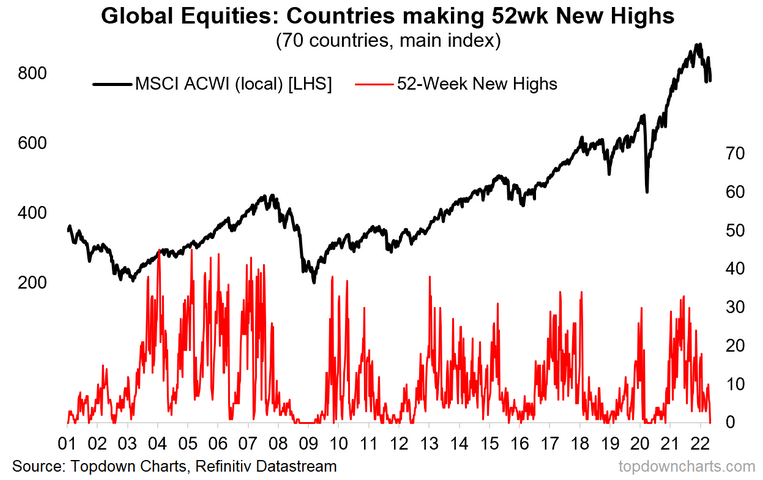
Moreover, we find that other breadth indicators point to further downside—the proportion of countries rising on a year-on-year basis is on the cusp of triggering a bear market signal. Even the S&P 500, a major 2021 outperformer, is down from a year ago. Including dividends, SPY is up just 1 basis point.
Lower Prices, But No Capitulation Yet
The clear collapse in bullish momentum warrants a re-rating downward in expectations for the balance of the year. We need to see more countries hit technical bear market territory for a decent washout to be declared. Often, bear markets end with a crescendo of selling, not a calm dip. Our weekly report also analyzes global equity market internals to get a gauge of risk appetite under the surface. A final piece of the bearish pie rests with Central Banks—policy actions could lead to earnings headwinds for multinational firms.
Bottom Line: We remain cautious on global equities. 2022 was shaping up to be a tough year for the bulls in our view, and the S&P 500’s worst start to a year since 1950 (price return) certainly verifies that. Bearish technicals, weakening earnings revisions, and downside risks to economic growth lead us to reiterate a bearish view on stocks.
Trading in financial instruments and/or cryptocurrencies involves high risks including the risk of losing some, or all, of your investment amount, and may not be suitable for all investors. Prices of cryptocurrencies are extremely volatile and may be affected by external factors such as financial, regulatory or political events. Trading on margin increases the financial risks.
Before deciding to trade in financial instrument or cryptocurrencies you should be fully informed of the risks and costs associated with trading the financial markets, carefully consider your investment objectives, level of experience, and risk appetite, and seek professional advice where needed.
Fusion Media would like to remind you that the data contained in this website is not necessarily real-time nor accurate. The data and prices on the website are not necessarily provided by any market or exchange, but may be provided by market makers, and so prices may not be accurate and may differ from the actual price at any given market, meaning prices are indicative and not appropriate for trading purposes. Fusion Media and any provider of the data contained in this website will not accept liability for any loss or damage as a result of your trading, or your reliance on the information contained within this website.
It is prohibited to use, store, reproduce, display, modify, transmit or distribute the data contained in this website without the explicit prior written permission of Fusion Media and/or the data provider. All intellectual property rights are reserved by the providers and/or the exchange providing the data contained in this website.
Fusion Media may be compensated by the advertisers that appear on the website, based on your interaction with the advertisements or advertisers.