Global Equity Technicals Point To More Downside Risk
Mike Zaccardi, CFA, CMT | Mar 15, 2022 01:40AM ET
This post was originally published at TopDown Charts
-
Global equities endured another tough week as geopolitical tensions rage
-
Is the current drawdown like March 2020? We take a look at key gauges.
-
We see more shaky periods ahead as downside participation increases
Global stocks are down more than 10% for the year. Damage-trackers we monitor still suggest the correction, bear market, (or whatever you want to call it), is still in the early innings. Previous points of strength are turning into points of weakness today. It’s also a mid-term election year which is often challenging for the bulls through the third quarter.
Another Rough Week
Last week, US stocks fell nearly 3% while foreign equities actually managed to outperform a smidgen. Value niches were also ‘less bad.’ Bonds, however, suffered significant losses as interest rates rose and credit fears mounted. Investment grade fixed income fell about 3% while junk bonds were down 2%. The selling expanse is vast in 2022.
From a Range to a Downturn
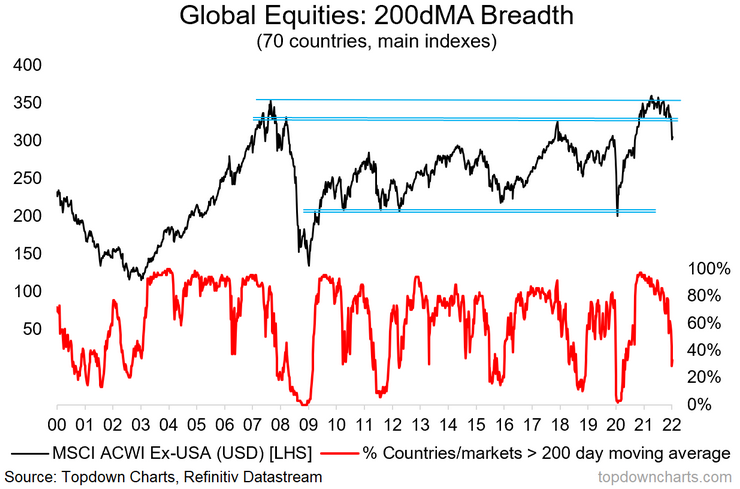
For ex-US stocks, last year’s pause in the uptrend has turned into a decided roll-over. Our featured chart below illustrates how the broad international equity market found resistance at the 2007 peak. It also failed to find support at the January 2018 zenith.
Investors are left wondering where things will bottom out. Meanwhile, the 200dma moving average breadth indicators proves that downside participation is strong. The bears are clearly in control. The percent of countries in long-term stock market downtrends is more than 70%.
Shades of March 2020? Yes and No
Our flagship dives into the similarities between today’s market and that of March 2020. There are some key differences, too.
Still, bears might be about to roar—the proportion of countries that are positive over the last 12 months is on the cusp of crossing below an important threshold that has historically been a hallmark of definitive bear markets.
Market Pulse
What’s another damage-meter? Fresh 52-week lows. International equities have fallen fast, but the number of new lows is somewhat tame right now. Just 20% of 70 countries we keep tabs on have made a new low. Many stock markets peaked in March or June last year, so it might just be a matter of time before this gauge perks up. The downward thrust among equities still looks early according to this indicator.
Technical Bear Market Count
Moreover, a surprisingly low number of countries are in technical bear market territory (down 20%). We assert that more bearish participation will take place in the coming months to solidify 2021 and 2022 as another global bear market—perhaps like what we saw in 2015-2016 or 2000-2002.
All bear markets are different though. The contrasts to the current environment versus that of March 2020 are many. Growth was a relative safe haven during the COVID Crash but is now a source of weakness. Monetary policy also cushioned the blow but is now a major headwind.
Bottom Line: We remain bearish global equities. We see some opportunities though. This week’s report identifies good risk/reward areas in EMFX and among LatAm equities. Big picture though, weak technicals, policy and inflation headwinds, and a lack of a value case continue to point to volatile times ahead for global investors.
Trading in financial instruments and/or cryptocurrencies involves high risks including the risk of losing some, or all, of your investment amount, and may not be suitable for all investors. Prices of cryptocurrencies are extremely volatile and may be affected by external factors such as financial, regulatory or political events. Trading on margin increases the financial risks.
Before deciding to trade in financial instrument or cryptocurrencies you should be fully informed of the risks and costs associated with trading the financial markets, carefully consider your investment objectives, level of experience, and risk appetite, and seek professional advice where needed.
Fusion Media would like to remind you that the data contained in this website is not necessarily real-time nor accurate. The data and prices on the website are not necessarily provided by any market or exchange, but may be provided by market makers, and so prices may not be accurate and may differ from the actual price at any given market, meaning prices are indicative and not appropriate for trading purposes. Fusion Media and any provider of the data contained in this website will not accept liability for any loss or damage as a result of your trading, or your reliance on the information contained within this website.
It is prohibited to use, store, reproduce, display, modify, transmit or distribute the data contained in this website without the explicit prior written permission of Fusion Media and/or the data provider. All intellectual property rights are reserved by the providers and/or the exchange providing the data contained in this website.
Fusion Media may be compensated by the advertisers that appear on the website, based on your interaction with the advertisements or advertisers.