Global Equity Breadth Check
Callum Thomas | Oct 09, 2017 12:06AM ET
In this article we look at a 3 key charts on global equities that utilize market breadth techniques. In this case we are looking at the breadth across country benchmarks i.e. the main stock market benchmark of all countries where decent pricing data was available (70 countries in this case). I talked about how we use breadth indicators to generate insights on the key trends in global equities in the article economic cycle indicators ), and also with reference to your ability to act on the alarm and the consequences of a correct alarm. Something to think about! Would love to hear your thoughts on the matter - either get in touch or post in the comments below...
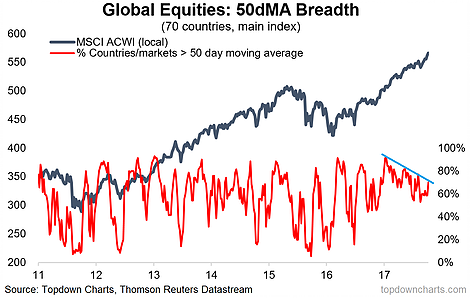
We're seeing ongoing divergence in Global Equities country breadth on a 50-day moving average basis (i.e. higher highs in the iShares MSCI ACWI (NASDAQ:ACWI) vs progressively lower highs in the breadth indicator).
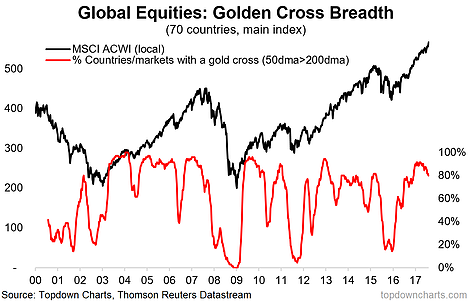
"Golden Cross Breadth" (i.e. proportion of countries with their 50dma above the 200dma) is rolling over, this can be an early warning sign.
Taking the flip-side of the previous chart, this one shows the number of countries undergoing a "death cross" - the opposite of a golden cross, where the 50 day moving average falls below the 200 day. It's basically the same signal, but perhaps looks a little bit more interesting when presented this way...
Trading in financial instruments and/or cryptocurrencies involves high risks including the risk of losing some, or all, of your investment amount, and may not be suitable for all investors. Prices of cryptocurrencies are extremely volatile and may be affected by external factors such as financial, regulatory or political events. Trading on margin increases the financial risks.
Before deciding to trade in financial instrument or cryptocurrencies you should be fully informed of the risks and costs associated with trading the financial markets, carefully consider your investment objectives, level of experience, and risk appetite, and seek professional advice where needed.
Fusion Media would like to remind you that the data contained in this website is not necessarily real-time nor accurate. The data and prices on the website are not necessarily provided by any market or exchange, but may be provided by market makers, and so prices may not be accurate and may differ from the actual price at any given market, meaning prices are indicative and not appropriate for trading purposes. Fusion Media and any provider of the data contained in this website will not accept liability for any loss or damage as a result of your trading, or your reliance on the information contained within this website.
It is prohibited to use, store, reproduce, display, modify, transmit or distribute the data contained in this website without the explicit prior written permission of Fusion Media and/or the data provider. All intellectual property rights are reserved by the providers and/or the exchange providing the data contained in this website.
Fusion Media may be compensated by the advertisers that appear on the website, based on your interaction with the advertisements or advertisers.