GBP/NZD Slides Below Upside Support Line
JFD Team | Mar 08, 2019 07:11AM ET
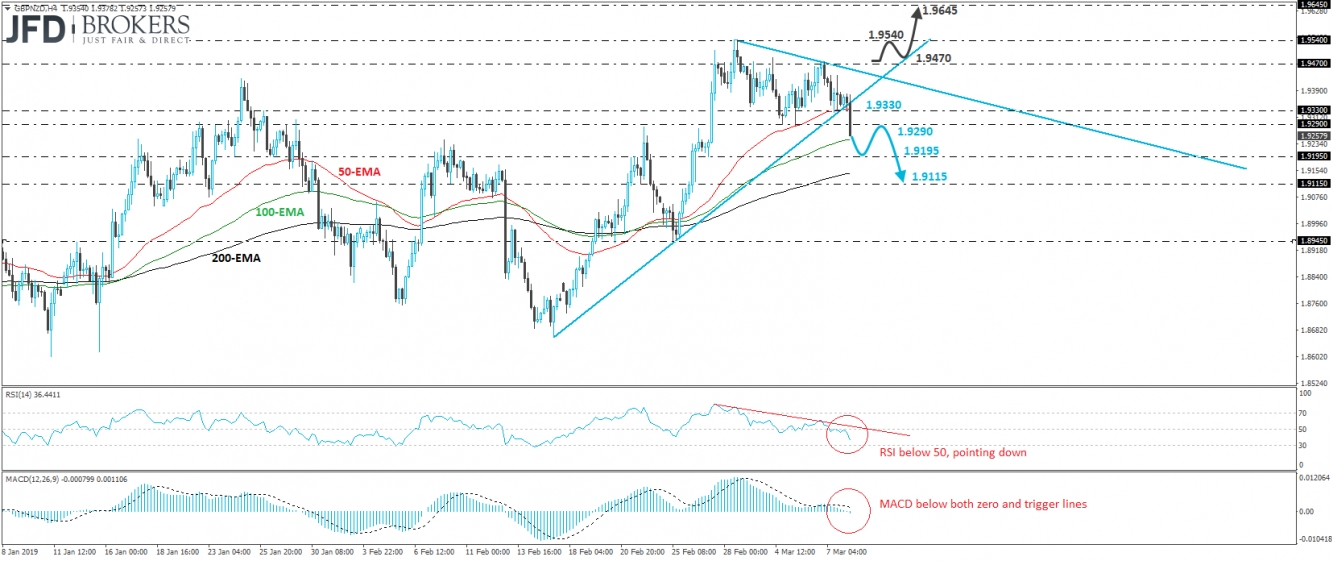
GBP/NZD tumbled during the European morning Friday, breaking below the 1.9330 level and the upside support line drawn from the low February 15th. Then, the rate dipped below the 1.9290 support (now turned into resistance), that way completing a failure swing top formation on the 4-hour chart. What’s more, the pair is also trading below a downside line taken from the high of February 28th. So, having all that in mind, we believe that the short-term picture has now turned to the downside.
We believe that the break below 1.9290 may have opened the way for the 1.9195 zone, defined by the low of February 27th. If that zone fails to halt the slide, then we may experience extensions towards the 1.9115 barrier, which is marked by an intraday swing low formed on February 21st. Another break, below 1.9115, may carry larger bearish implications, perhaps paving the way for the low of February 25th at around 1.8945.
Looking at our short-term oscillators, we see that the RSI runs below 50 and points down, while the MACD, already below its trigger line, has just touched its toe below zero. These indicators detect negative momentum and corroborate our view for some further short-term declines.
On the upside, we would like to see a clear close above 1.9470 before we start examining whether the bears have abandoned the battlefield. Such a move would bring the rate above both the aforementioned diagonal lines and may initially aim of the peak of February 28th, at around 1.9540. If the bulls do not stop at that obstacle, their next destination may be the high of November 6th, near 1.9645.
![]()
Trading in financial instruments and/or cryptocurrencies involves high risks including the risk of losing some, or all, of your investment amount, and may not be suitable for all investors. Prices of cryptocurrencies are extremely volatile and may be affected by external factors such as financial, regulatory or political events. Trading on margin increases the financial risks.
Before deciding to trade in financial instrument or cryptocurrencies you should be fully informed of the risks and costs associated with trading the financial markets, carefully consider your investment objectives, level of experience, and risk appetite, and seek professional advice where needed.
Fusion Media would like to remind you that the data contained in this website is not necessarily real-time nor accurate. The data and prices on the website are not necessarily provided by any market or exchange, but may be provided by market makers, and so prices may not be accurate and may differ from the actual price at any given market, meaning prices are indicative and not appropriate for trading purposes. Fusion Media and any provider of the data contained in this website will not accept liability for any loss or damage as a result of your trading, or your reliance on the information contained within this website.
It is prohibited to use, store, reproduce, display, modify, transmit or distribute the data contained in this website without the explicit prior written permission of Fusion Media and/or the data provider. All intellectual property rights are reserved by the providers and/or the exchange providing the data contained in this website.
Fusion Media may be compensated by the advertisers that appear on the website, based on your interaction with the advertisements or advertisers.