GBP/JPY Oscillates Within Sideways Range
JFD Team | Apr 06, 2020 07:22AM ET
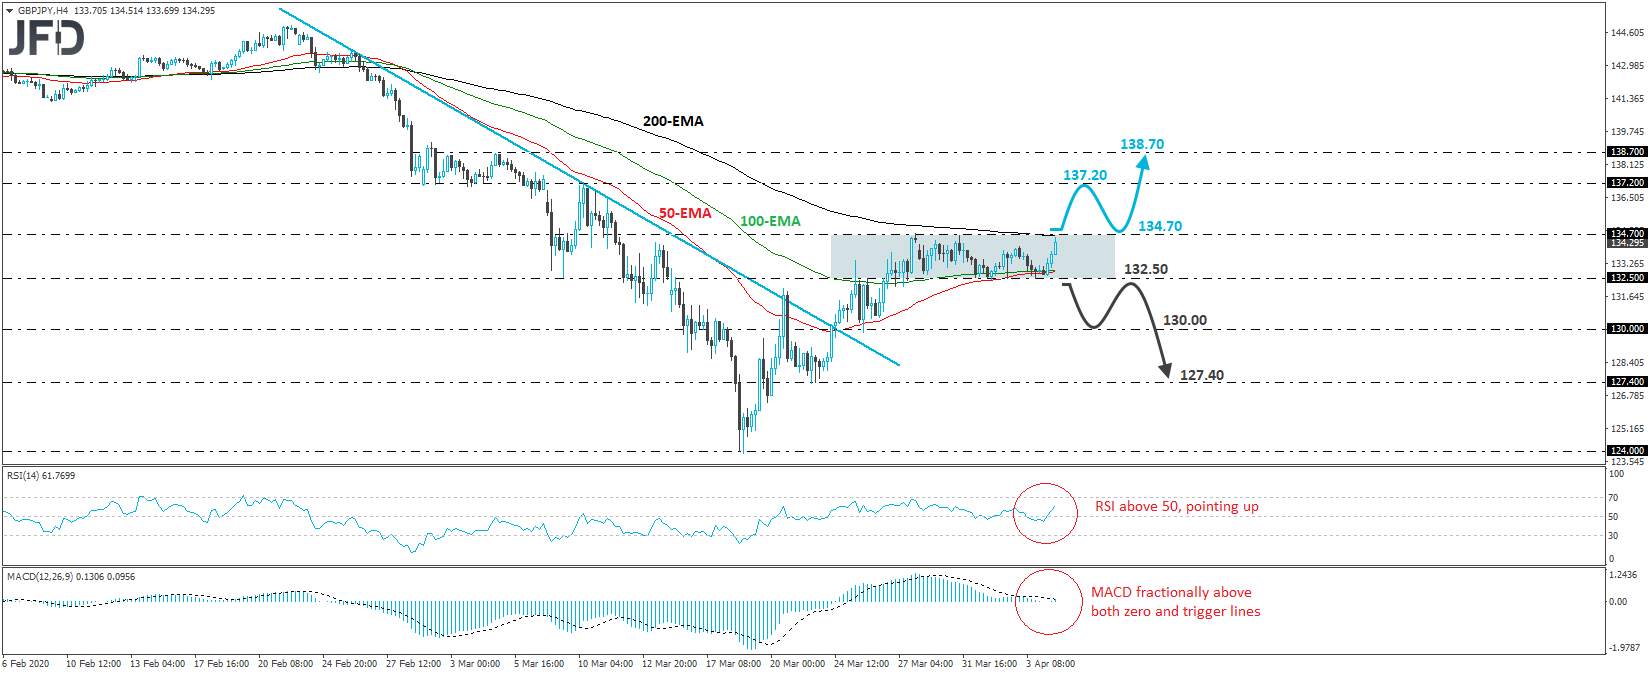
GBP/JPY traded higher today after hitting support once again near the 132.50 zone. Overall, the pair oscillates between that hurdle and the resistance of 134.70 since March 26th, and thus, we will adopt a flat stance with regards to the short-term outlook. That said, bearing in mind the rate’s proximity to the upper bound of the range, we would see slightly more chances for an upside exit, rather than a downside one.
A decisive break above 134.70 would not only confirm a forthcoming higher high on the 4-hour chart, but it would also bring the rate above the 200-EMA. This may encourage the bulls to climb towards the 137.20 obstacle, marked by the high of March 10th, the break of which could extend the advance towards the 138.70 zone, which provided decent resistance between March 3rd and 5th.
Shifting attention to our short-term oscillators, we see that the RSI rebounded back above its 50 line and now points to the upside, while the MACD sits fractionally above both its zero and trigger lines. Both indicators suggest that the rate may start picking up upside speed soon and support the notion that the chances of an upside exit out of the range are more than those of a downside one.
In order to start examining whether the bears have taken the steering wheel, we would like to see GBP/JPY breaking below 132.50. This would confirm a forthcoming lower low on the 4-hour chart and may initially allow declines towards the psychological zone of 130.00, which is also marginally above the low of March 25th. If the bears are not willing to stop there, then a move lower could pave the way towards the low of March 23rd, at around 127.40.
![]()
Trading in financial instruments and/or cryptocurrencies involves high risks including the risk of losing some, or all, of your investment amount, and may not be suitable for all investors. Prices of cryptocurrencies are extremely volatile and may be affected by external factors such as financial, regulatory or political events. Trading on margin increases the financial risks.
Before deciding to trade in financial instrument or cryptocurrencies you should be fully informed of the risks and costs associated with trading the financial markets, carefully consider your investment objectives, level of experience, and risk appetite, and seek professional advice where needed.
Fusion Media would like to remind you that the data contained in this website is not necessarily real-time nor accurate. The data and prices on the website are not necessarily provided by any market or exchange, but may be provided by market makers, and so prices may not be accurate and may differ from the actual price at any given market, meaning prices are indicative and not appropriate for trading purposes. Fusion Media and any provider of the data contained in this website will not accept liability for any loss or damage as a result of your trading, or your reliance on the information contained within this website.
It is prohibited to use, store, reproduce, display, modify, transmit or distribute the data contained in this website without the explicit prior written permission of Fusion Media and/or the data provider. All intellectual property rights are reserved by the providers and/or the exchange providing the data contained in this website.
Fusion Media may be compensated by the advertisers that appear on the website, based on your interaction with the advertisements or advertisers.