FX Majors: Analysis on Cycles, Vols, Correl, Levels for Nov 1
Ivan Delgado | Oct 31, 2018 11:04PM ET
Authored by Ivan Delgado, Head of Market Research at Global Prime. The purpose of these institutional-level chart studies is to provide an assessment of the market conditions for the next 24h of trading in order to assist one’s decisions on a regular basis. It, therefore, aims to anticipate the next cycle structures based on volume activity, order flow, correlations, and levels. The analysis is equally relevant for intraday, swing and position traders, as I break down the charts from the weekly down to the hourly.
Risk sentiment model: DXY and equities move up in tandem
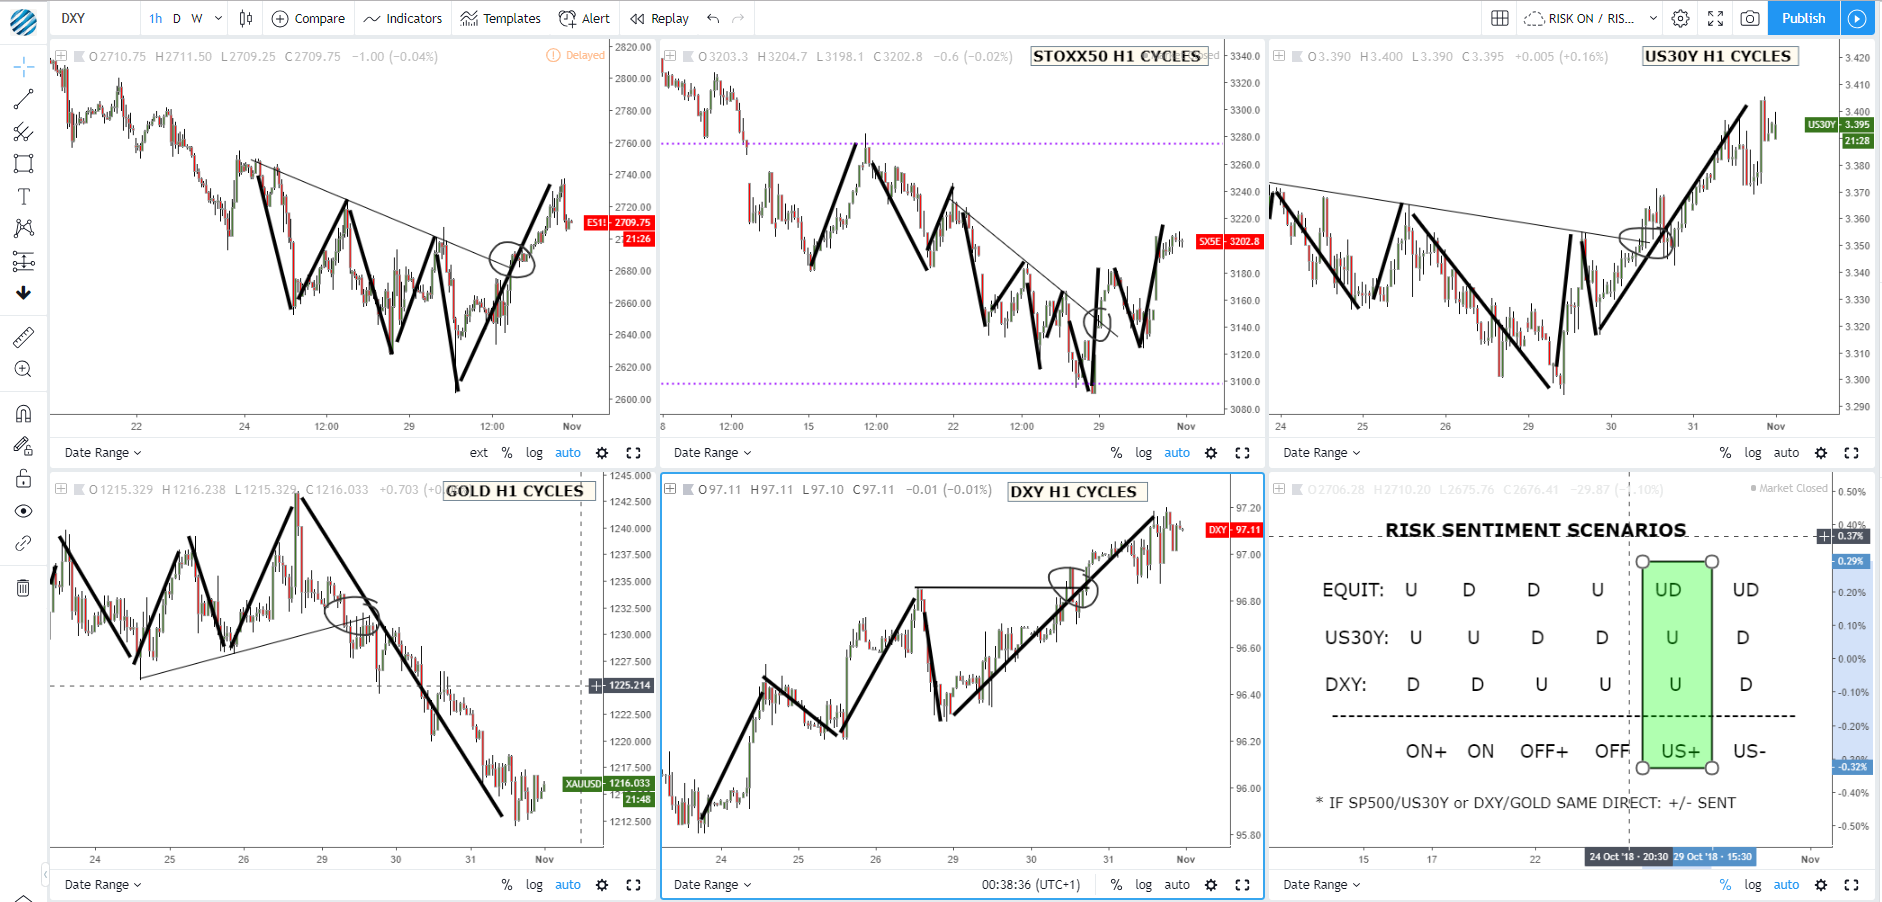
The breakout through the descending trendline in the S&P 500 was materialized in the first hour of cash trading. That was the missing piece to confirm our thesis of a constructive risk environment, encapsulated within a USD strength context, as per the active up-cycles in the DXY and US yields. It was the last day of the month, so the market had to contend with FX rebalancing flows, which would always make this day more unpredictable in nature.
We should now be reverting back to a clean slate in terms of risk sentiment dynamics, hence judging by the cycles I am seeing, I expect JPY crosses to remain on the backfoot, while the USD should continue to find grateful buyers on dips. The present context would still justify European currencies (EUR, GBP, CHF) to trade heavy against the likes of commodity FX as the recovery in equities extends, but the positive Brexit headlines in the last 24h are likely to distort this view.
EUR/USD: USD buy-side flows confirm fresh hourly down-cycle
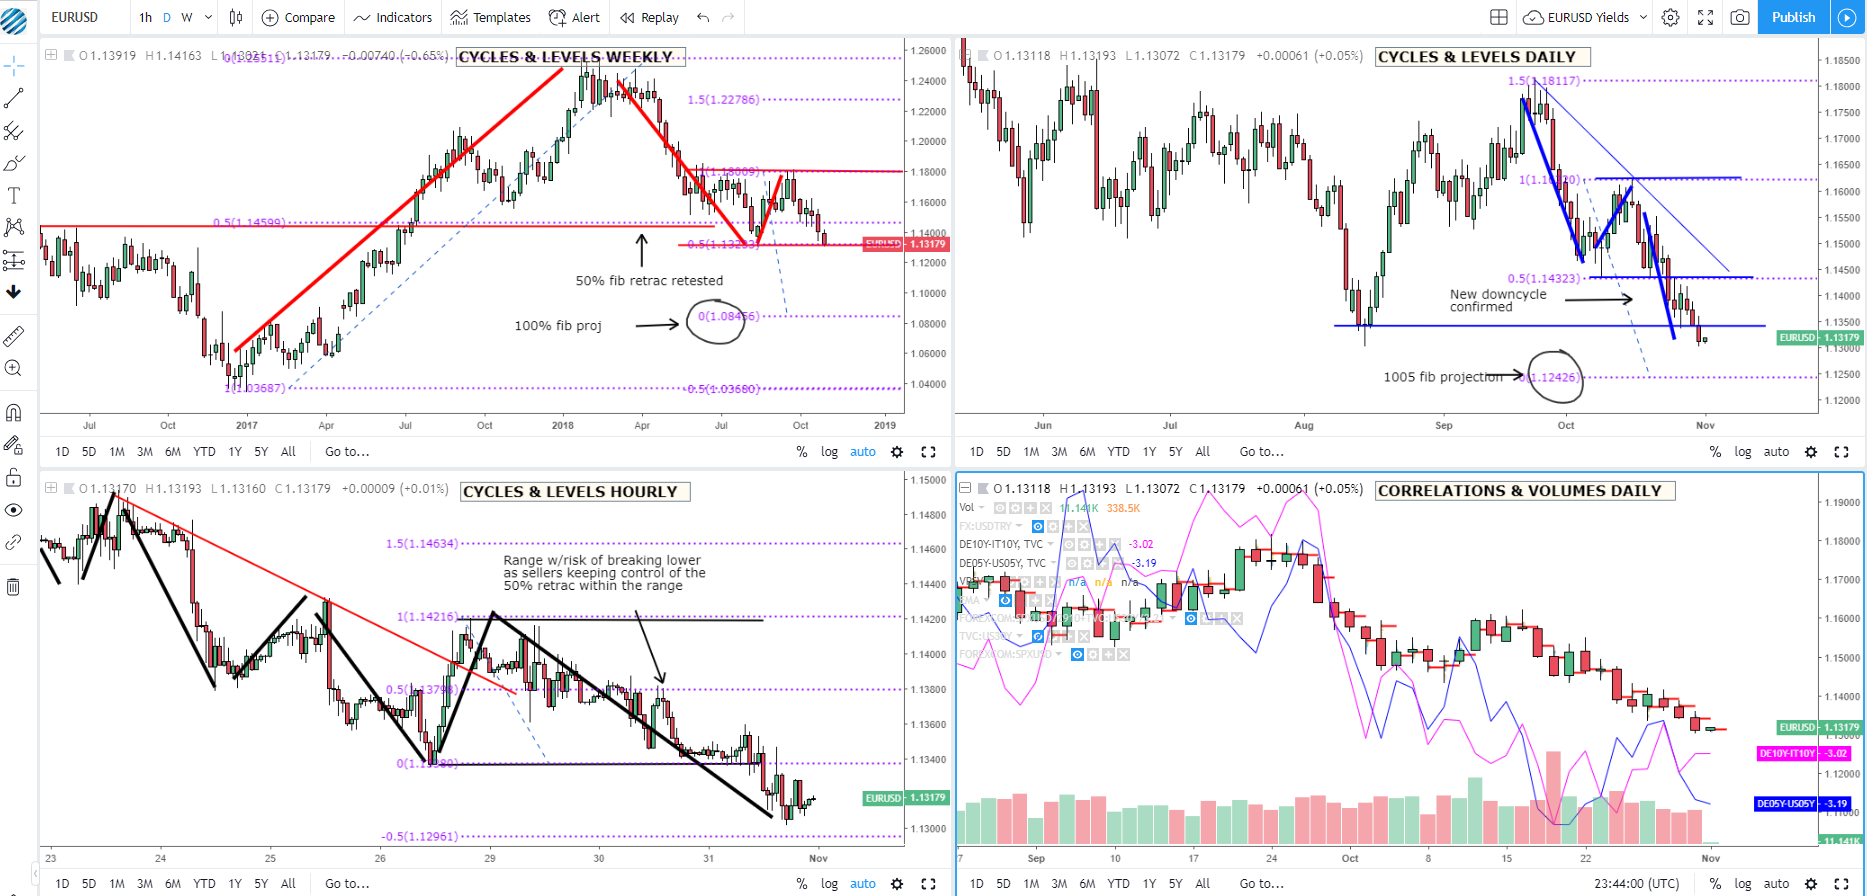
Cycles & Levels:
Subject to the US NFP outcome, the odds are on the rise of seeing a back-to-back bearish week with a close below the 50% fib retrac of last year’s meteoric rise. If the weekly candle can make it sub the Aug 13 swing low, that would strengthen the case for an ultimate weekly downside target of 1.0845. On the daily, if sellers garner enough momentum through the 1.13 round number, the new sell-side campaign could exploit a 65-70 pips leeway until the proj target of 1.1242 is reached. Don’t rule out a potential rebound as we are at a crossroads here (Aug 15 validated swing low) On the hourly, the re-grouping of sellers at the mid-point of Wednesday’s range honored with precision those avid enough to read price action. The rejection of a range’s mid-point is a great predictor showing us the potential directional resolution of range-bound conditions.
Correlations & Volumes: The risk of an exhaustive move is fading as the latest 24h of tick volume activity show an increase in commitment, which reinforces follow-through downside risks. The absence of profit-taking at 5pm NY is another negative input, as it is the fact that sellers keep buyers trapped on the wrong side of the market judging by Wednesday’s POC (1.1344). In terms of correlations, the German vs US 5-year yield spread keeps trending lower, just a stone’s throw from claiming new multi-year lows. Meanwhile, the other key driver (Italian premium vs German) is consolidating, which reduces the risk of acting as a key driver.
Drivers & Risk events: The Euro continues pressured via lower growth expectations in the EZ (poor showing in the latest EZ or Italian GDP), which raises the risks of a more cautious ECB. Besides, the Italian and Brexit conundrum is also weighing. In the last 24h, positive USD flows on month-end rebalancing and upbeat ADP employment data anchored the currency further, as does the USD strength environment highlighted above. It’s a public bank holiday in both France and Italy on Thursday. In the US we get the US manufacturing PMI.
GBP/USD: First validated swing high in over 2 weeks
Cycles & Levels:
Last Friday’s weekly close told us a story. That the risk of the Aug 13 low being re-tested was within sight. That’s what we’ve seen before a rather vigorous rebound off this support.If the recovery can make it up towards 1.30, it would confirm a range in the weekly, while on the daily the down-cycle remains firmly in place. Despite the pick up in GBP, there is still pending business to the downside to achieving the 100% fib proj target. The current ongoing buy-side campaign could perfectly target a re-test of the broken support-turned-resistance at 1.2930. The hourly is starting to provide the first tentative signs of a new up-cycle in the making. I’d be waiting for acceptance above the previous swing high to give the current recovery more credentials of its health.
Correlations & Volumes: The sequence of volumes fails to provide sufficient intentional clues in the last 24h. On the contrary, the depressed UK vs US 5-year yield spread valuation makes a test of 1.2930 a compelling opportunity to consider a re-engagement in short-side action all else being equal. Considering the USD strength environment we are in, it should assist this thesis.
Drivers & Risk events: Renewed Brexit optimism is behind the recovery in the Pound after UK’ Brexit Minister Raab put a date (Nov 21) to a potential deal with the EU. In the coming 24h, UK manuf PMI and the BoE monetary policy are scheduled, while in the US we get the US manufacturing PMI.
USD/JPY: Risk profile and daily structure suggest dip-buying
Cycles & Levels:
The weekly structure remains unambiguously bullish as per higher highs and higher lows. Similarly, the daily has validated a new up-cycle structure, which increases the chances of a follow through continuation inline with the main trend up. The acceptance above the previous swing high above 113.00 gives us a target of 114.37 to the upside, hence making the prospects of buy on dips an attractive proposition from a risk-reward perspective. On the hourly, any setback down towards a backside retest of the broken trendline would start becoming tempting to add longs.
Correlations & Volumes: Wednesday’s low volume bearish candle is far from being a concern for the interest of buyers. Besides, the risk environment should still see the market emboldened with an appetite to gain short yen exposure, especially amid up-cycles in the DXY and US yields, leaving aside higher equities. It’s a perfect scenario to see yen crosses retaining the buy-side bias.
Drivers & Risk events: On Wednesday, the Bank of Japan kept its status quo and therefore acted as a non-event. The Yen seems to have benefited from month-end flows but nothing else to chew here. The upward bias is further supported by Wednesday’s positive ADP (NASDAQ:ADP) number out of the US. Today’s US ISM manuf PMI is the next risk event to monitor. I’d personally be looking to buy the dip.
AUD/USD: Stubborn Aussie stuck mid-point of the daily range
Cycles & Levels:
On the weekly, we are still short of the ultimate target of 0.6892, but as a caveat, note that 0.70 could be acting as that point where a substantial reversal is seen. Nonetheless, the weekly remains in a firm downtrend. On the daily, last Friday’s bullish absorption off 0.7050 head fake continues to play out as the market morphs into a newly established range between 0.7050 and 0.7150, with the current price stuck right in the middle. On the hourly, we are at risk of finding ourselves in yet another range after the violation of the ascending trendline. Acceptance above 0.7125 or below 0.7050 is needed to stimulate this market into new cycles.
Correlations & Volumes: As I reiterated several times, as correlations stand, one shouldn’t expect the Aussie to be an outperformer by any means under this environment. Yes we have equities heading higher again, but gold is selling-off (AUD -), DXY is up (AUD -), the Yuan keeps weakening towards the USD/CNY 7.00 mark (AUD-) and AU vs US yield spread remains depressed (AUD-). No much to read from volumes in the last 24h.
Drivers & Risk events: The reduction in EM volatility alongside potential macro bids ahead of 0.70 are elements allowing the Aussie to stay better bid. The failure to go lower even as equities got wreaked havoc in recent weeks has been a strong statement of the market’s determination to hold the ground above 0.70. Australian trade balance came better than expected for Sept, giving a boost to the Aussie once again early Thursday. Later in the US, the ISM manuf is the next key risk to monitor.
Important Footnotes:
- Risk sentiment model: The fact that financial markets have become so intertwined and dynamic makes it essential to stay constantly in tune with market conditions and adapt to new environments. This prop model will assist you to gauge the context that you are trading so that you can significantly reduce the downside risks. To understand the principles applied in the assessment of this model, refer to the following tutorial How to Unpack Risk Sentiment Profiles
- Cycles: Markets tend to move in cycles followed by a period of distribution and/or accumulation. The weekly cycles are highlighted in red, blue refers to the daily, while the black lines represent the hourly cycles. To understand the principles applied in the assessment of cycles, refer to the following tutorial
- POC: It refers to the point of control. It is depicted by a red line on the bottom right side chart for each candle. It represents the areas of most interest by trading volume and should act as walls of bids/offers that may result in price reversals. The volume profile analysis tracks trading activity over a specified time period at specified price levels. The study reveals the constant evolution of the market auction process. If you wish to find out more about the importance of the POC, refer to the following tutorial
- Tick Volume: The analysis of price updates activity provides great insights into the actual buy or sell-side commitment to be engaged into a specific directional movement. There have been various
- Horizontal Support/Resistance: Unlike other levels of dynamic support or resistance such as Fibonacci retracements, pivot points, trendlines, or other forms of reactive areas, the horizontal lines of support and resistance are universal concepts used by the majority of market participants. It, therefore, makes the areas the most widely followed and relevant to monitor.
- Trendlines: Besides the horizontal lines, trendlines are helpful as a visual representation of the trend. The trendlines are drawn respecting a series of rules that determine the validation of a new cycle being created. Therefore, these trendline drawn in the chart hinge to a certain interpretation of market structures.
- Correlations: Each forex pair has a series of highly correlated assets that can add an edge to your trading. This type of study is called inter-market analysis and it involves scoping out anomalies in the ever-evolving global interconnectivity between equities, bonds, currencies, and commodities. If you would like to understand more about this concept, refer to the tutorial How Divergence In Correlated Assets Can Help You Add An Edge .
- Fundamentals: It’s important to highlight that this outlook is subject to the impact of the fundamental news. Any unexpected news may cause the price to behave erratically in the short term.
- Projection Targets: The power behind the 100% Fibonacci projection resides in the symmetry and harmonic relationships of market cycles. By drawing a 100% Fibonacci projection, you can anticipate the area in the chart where some type of pause and potential reversals in price is likely to occur, due to 1. The side in control of the cycle takes profits 2. Counter-trend positions are added by contrarian players 3. These are price points where limit orders are set by market-makers. You can find out more by reading the tutorial on
Trading in financial instruments and/or cryptocurrencies involves high risks including the risk of losing some, or all, of your investment amount, and may not be suitable for all investors. Prices of cryptocurrencies are extremely volatile and may be affected by external factors such as financial, regulatory or political events. Trading on margin increases the financial risks.
Before deciding to trade in financial instrument or cryptocurrencies you should be fully informed of the risks and costs associated with trading the financial markets, carefully consider your investment objectives, level of experience, and risk appetite, and seek professional advice where needed.
Fusion Media would like to remind you that the data contained in this website is not necessarily real-time nor accurate. The data and prices on the website are not necessarily provided by any market or exchange, but may be provided by market makers, and so prices may not be accurate and may differ from the actual price at any given market, meaning prices are indicative and not appropriate for trading purposes. Fusion Media and any provider of the data contained in this website will not accept liability for any loss or damage as a result of your trading, or your reliance on the information contained within this website.
It is prohibited to use, store, reproduce, display, modify, transmit or distribute the data contained in this website without the explicit prior written permission of Fusion Media and/or the data provider. All intellectual property rights are reserved by the providers and/or the exchange providing the data contained in this website.
Fusion Media may be compensated by the advertisers that appear on the website, based on your interaction with the advertisements or advertisers.