Fundamentally Speaking: Earnings Optimism Explodes
Lance Roberts | Apr 13, 2021 05:45AM ET
As markets surge to record highs, analysts are rushing to ratchet up earnings estimates as optimism explodes.
“The first quarter of 2021 marked the largest increase in the bottom-up EPS estimate during a quarter since FactSet began tracking the quarterly bottom-up EPS estimate in Q2 2002. The previous record was 5.4%, which occurred in Q1 2018 after tax reform was passed.” – FactSet
Of course, with market’s at record highs, Wall Street needs drastically higher estimates to rationalize bullish allocations. However, before we get into the risks of forward expectations, let’s review what happened.
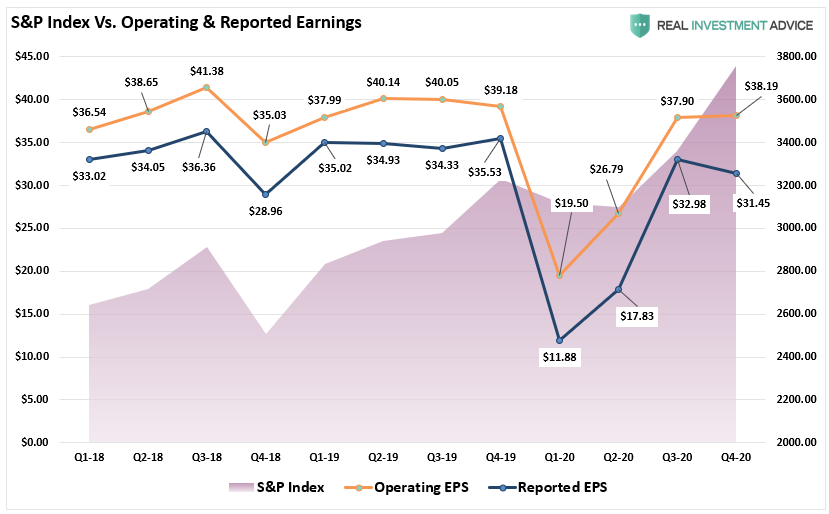
A Disappointing Past
Through the end of 2020, quarterly operating earnings increased $0.01 to $38.19 from $38.18 at the end of 2019.
You read that correctly.
Quarterly operating earnings, which are mostly useless as companies exclude all the “bad stuff” and fudge the rest, increased by just $0.01 while markets exploded 16.28% in 2020.
It is far worse when looking at “real” reported earnings, which declined -11.4% from $35.53 to $31.45.
However, the good news is these are very sharp recoveries from the Q1-2020 lows of $19.50 and $11.98 per share, respectively, as the economy reopened.
With markets at record highs, have investors “priced in” the most optimistic outlooks for the economy and earnings growth?
Earnings Growth Not As Strong As Advertised
Analysts always over-estimate earnings by about 33% on average. As discussed in
“The biggest single problem with Wall Street is the consistent disregard of the possibilities for unexpected, random events. In a 2010 study, by the McKinsey Group, they found that analysts have been persistently overly optimistic for 25 years. During the 25-year time frame, Wall Street analysts pegged earnings growth at 10-12% a year when in reality earnings grew at 6% which, as we have discussed in the past, is the growth rate of the economy.”
Get The News You Want
Read market moving news with a personalized feed of stocks you care about.Get The App“This is why using forward earnings estimates as a valuation metric is so incredibly flawed—as the estimates are always overly optimistic roughly 33% on average.”
Such is incredibly important when you begin to think about “valuation” and forward returns. Take a look at the chart below.
In January of 2020, S&P put out their first earnings estimates through the end of 2021. At that time, they estimated the S&P 500 index would print “reported” earnings of $171/share in 2021. As of the latest report, expectations for 2021 are now $13 lower at $158/share. Yet, investors are paying 20.4x earnings today for what they thought would be 18.8x earnings.
In the latest earnings report from S&P, they also included estimates through the end of 2022. Those initial estimates currently suggest earnings will surge from $158 to $183 per share. Such would be a $25 per share increase. That certainly seems impressive until you realize it’s only $12 higher than the original botched estimates.
This is not an isolated case due to the pandemic. As Mackenzie noted in their study, on average, “analysts’ forecasts have been almost 100% too high,” which leads investors to make much more aggressive bets in the financial markets.
Likely Priced In
Here is the problem for investors currently. Given analysts’ assumptions are always high, and markets are trading at more extreme valuations, such leaves little room for disappointment. As shown, using analysts' price target assumptions of 4700 for 2020 and current earnings expectations, the S&P is trading 2.6x earnings growth.
Such puts the current P/E at 25.6x earnings in 2020, which is still expensive by historical measures.
That also puts the S&P 500 grossly above its linear trend line as earnings growth begins to revert.
Through the end of this year, companies will guide down earnings estimates for a variety of reasons:
- Economic growth won’t be as robust as anticipated.
- Higher corporate tax rates will reduce earnings.
- The increased input costs due to the stimulus can’t get passed on to consumers.
- Higher interest rates increasing borrowing costs which impact earnings.
- A weaker consumer than currently expected due to reduced employment and weaker wages.
- Global demand weakens due to a stronger dollar impacting exports.
Such will leave investors once again “overpaying” for earnings growth that fails to materialize.
Help From Buybacks
As noted in Powell’s Easy Money Promise, share repurchases have made up roughly 100% of the net purchases of stocks previously. During the economic shutdown, companies issued shares for capital and drew down credit lines. However, with the crisis past, that mountain of liquidity is flowing into buybacks.
“Instead of expanding production, increasing sales, acquiring competitors, or making capital investments, the money gets used for a one-time boost to earnings on a per-share basis. This past week, share buybacks hit a new record."
Without the reduction of the share count, the vast majority of companies would miss earnings estimates.
Since 2009, corporate operating earnings have grown by 278%. During that same period, the cumulative growth of revenue is only up 60%. It is through “accounting magic” that revenue gets multiplied to the bottom line. Out of each dollar of earnings, 76% is from accounting “management,” and 24% is from revenue.
Chart updated through 04-01-21
As noted, a majority of the rise in “profitability” came from a variety of cost-cutting measures and accounting gimmicks rather than actual increases in top-line revenue. While tax cuts certainly provided the capital for a surge in buybacks, revenue growth, which is a function of a consumption-based economy, has remained muted.
As noted, since 2009, operating earnings have risen by 278%. However, reported earnings rose 318% in total. However, the earnings increase was not a function of an increase in revenue. Such only grew 66% during the same period. Concurrently, investors bid up the market more than 463% from the financial crisis lows of 666.
The problem with stock buybacks is they create an illusion of profitability.
A Likely Disappointment
This divergence in stock prices not only shows up in operating earnings but also in reported corporate profits. In October 2019, we warned of the deviation of the stock market from corporate profitability. To wit:
“If the economy is slowing down, revenue and corporate profit growth will decline also. However, it is this point which the ‘bulls’ should be paying attention to. Many are dismissing currently high valuations under the guise of ‘low interest rates,’ however, the one thing you should not dismiss, and cannot make an excuse for, is the massive deviation between the market and corporate profits after tax. The only other time in history the difference was this great was in 1999.”
Of course, in March, that gap began to close, but the Fed and Government’s massive interventions wound up exacerbating the issue. The updated chart from 2019 shows the problem.
While valuations don’t matter in the short-term, they do matter long-term. If markets hit more aggressive price targets and earnings expectations (which they rarely do), valuations will remain grossly expensive.
Furthermore, while the market rallied sharply in 2020 on continued “hopes” for more “stimulus” and continued accommodative actions from the Fed, the deviations from fundamentals have reached extremes only seen at peaks of previous market cycles.
A History Of Profits
The chart below shows the real, inflation-adjusted profits after-tax versus the cumulative change to the S&P 500. Here is the critical point—when markets grow faster than profitability, eventually, a reversion occurs. Such is simply the case that all excesses must get cleared before the next “organic” growth cycle can occur. Currently, we are once again trading at a more substantial premium to corporate profit growth.
Another way to look at the issue of profits as it relates to the market is below. When we measure the cumulative change in the S&P 500 index compared to the level of profits, we find that when investors pay more than $1 for a $1 worth of profits, there is an eventual mean reversion.
Since corporate profit growth is a function of economic growth longer term, we can also see how “expensive” the market is relative to corporate profit growth as a percentage of economic growth.
Once again, we find that when the price to profits ratio is trading ABOVE the long-term linear trend, markets have struggled and ultimately experienced a more severe mean-reverting event.
With the price to profits ratio once again elevated above the long-term trend, there is little to suggest that markets haven’t already priced in a good bit of future economic and profits growth.
It seems to be a simple formula for investors that as long as the Fed remains active in supporting asset prices, the deviation between fundamentals and fantasy doesn’t matter.
It is hard to argue that point. However, with investors paying more today than at any point in history for each $1 of profit, the subsequent mean reversion will be a humbling event.
Conclusion
While none of this suggests the market will “crash” tomorrow, it is supportive of the idea that future returns will be substantially weaker in the future. There are few, if any, Wall Street analysts expecting a recession currently, and many are confident of a forthcoming economic growth cycle. Yet, at this time, there are few catalysts supportive of such a resurgence.
- Economic growth outside of China remains weak
- Employment growth is going to slow.
- There is no massive disaster currently to spur a surge in government spending and reconstruction.
- There isn’t another stimulus package like tax cuts to fuel a boost in corporate earnings.
- With the deficit already pushing $1 Trillion, there will only be an incremental boost from additional deficit spending this year.
- Unfortunately, it is also just a function of time until a recession occurs.
Wall Street is notorious for missing significant turning points in markets and leaving investors scrambling for the exits.
While no one on Wall Street told you to be wary of the markets in 2018, we did. We also warned you early in 2020. but it largely fell on deaf ears as “F.O.M.O.” clouded basic investment logic.
It is pretty likely before we get to the end of 2022, it will happen again.
Trading in financial instruments and/or cryptocurrencies involves high risks including the risk of losing some, or all, of your investment amount, and may not be suitable for all investors. Prices of cryptocurrencies are extremely volatile and may be affected by external factors such as financial, regulatory or political events. Trading on margin increases the financial risks.
Before deciding to trade in financial instrument or cryptocurrencies you should be fully informed of the risks and costs associated with trading the financial markets, carefully consider your investment objectives, level of experience, and risk appetite, and seek professional advice where needed.
Fusion Media would like to remind you that the data contained in this website is not necessarily real-time nor accurate. The data and prices on the website are not necessarily provided by any market or exchange, but may be provided by market makers, and so prices may not be accurate and may differ from the actual price at any given market, meaning prices are indicative and not appropriate for trading purposes. Fusion Media and any provider of the data contained in this website will not accept liability for any loss or damage as a result of your trading, or your reliance on the information contained within this website.
It is prohibited to use, store, reproduce, display, modify, transmit or distribute the data contained in this website without the explicit prior written permission of Fusion Media and/or the data provider. All intellectual property rights are reserved by the providers and/or the exchange providing the data contained in this website.
Fusion Media may be compensated by the advertisers that appear on the website, based on your interaction with the advertisements or advertisers.