Fundamental And Technical Ratings For Key Regions And Countries
Richard Shaw | Oct 13, 2015 12:54AM ET
- A look at US, Eurozone, Japan, Emerging Markets, United Kingdom, Asia Pacific ex Japan, Switzerland, China.
- China and Emerging Markets most attractive from a PEG perspective (if you believe the forward estimates, and can stomach volatility)
- AsiaPacific ex Japan has by far the highest yield, but is very heavily concentrated in commodity sensitive Australia
- Technical views are somewhat mixed, but none are particularly attractive from the technical perspective
- Earnings declines, past and estimated, portend negatively for S&P 500 price
- The StockCharts (source: subscription) data is based on indicators covering the last 60-90 days of daily data.
- The Market-Edge (source: Schwab) service does not describe their decision tools, but says the time horizon for their ratings is 30-90 days.
- Barchart (source: free site) data is based on indicators covering the last 7 to 100 days of daily data.
- Our QVM 4 factor technical rating is based on the last 10-12 months of monthly data.
- Percent above/below 200-day EMA (30%)
- 125-Day Rate-of-Change (30%)
- Percent above/below 50-day EMA (15%)
- 20-day Rate-of-Change (15%)
- 3-day slope of PPO-Histogram (5%)
- 14-day RSI (5%)
- 7 Day Average Directional Indicator
- 10-8 Day Moving Average Hilo Channel
- 20 Day Moving Average vs Price
- 20 – 50 Day MACD Oscillator
20 Day Bollinger Bands - 40 Day Commodity Channel Index
- 50 Day Moving Average vs Price
- 20 – 100 Day MACD Oscillator
- 50 Day Parabolic Time/Price
- 60 Day Commodity Channel Index
- 100 Day Moving Average vs Price
- 50 – 100 Day MACD Oscillator
- A LONG Opinion implies that there is a high probability that stock should move up over the next 60-90 days.
- A NEUTRAL Opinion suggests that the supply/demand condition of the stock is in a state of flux and the likely hood is that the stock will trade sideways over the near term. A Neutral from Avoid indicates that the supply/demand condition is improving while a Neutral from Long indicates that the supply/demand condition is deteriorating.
- An AVOID Opinion can either denote a Short Sale candidate or a stock that has lost its positive momentum characteristics at this time should trade sideways to down over the next 30-60 days.
- Whether the price is above or below the 12-month moving average
- Whether the leading edge of the 12-month average is tilted up or down versus the prior month
- Whether the price is moving up at a reasonable pace (introduces time and pace — with an indicator called the parabolic stop & reverse )
- Whether the volume of trades is more at the upper end of daily price ranges or at the bottom end of daily price ranges (introducing trading volume — with an indicator called the money flow index ).
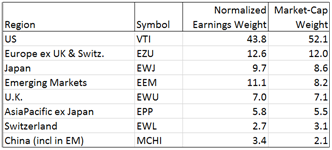
Let’s take a quick summary review of fundamental and technical ratings for key regions/countries: US, Eurozone, Japan, Emerging Markets, United Kingdom, Asia Pacific ex Japan, Switzerland, China.
The regions and countries were selected for market-cap significance within a world index of stock markets.
This table shows the market-cap weight of each within the FTSE Global All Cap Index. It also presents the relative size of the earnings of the markets within that index, generated by normalizing their P/E ratios.
The U.S. is still the giant relative to the others at 52% of market-cap and 44% of world earnings from listed companies.
China is a major economy, but with respect to listed companies, it is still a minor market at 2.1% of world index market-cap.
Here are several key fundamental valuation metrics for the securities representing those regions/countries—Vanguard Total Stock Market (N:VTI), iShares MSCI Eurozone (N:EZU), iShares MSCI Japan (N:EWJ), iShares MSCI Emerging Markets (N:EEM), iShares MSCI United Kingdom (N:EWU), iShares MSCI Pacific ex Japan (N:EPP), iShares MSCI Switzerland Capped (N:EWL), iShares MSCI China (N:MCHI), (source Morningstar):
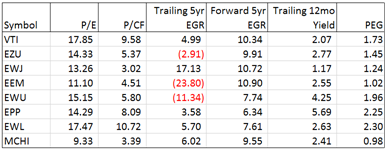
China and the emerging markets overall have the lowest P/E ratios (9.3x sand 11.1x), while the U.S. and Switzerland have the highest (17.9x and 17.5x). Note that Switzerland has a relatively small local economy, but is home to many global multi-national companies.
The U.S and Switzerland also have the highest price to cash flow (9.6x and 10.7x) while Japan, China and emerging markets have the lowest (3.0x, 3.4x and 4.5x). Europe is relatively more attractive by P/CF (5.4x) than the U.S. at (9.6x)
Japan has the lowest trailing yield at 1.17% while Asia Pacific ex Japan has the highest at 5.7%.
Additional note about the U.S (S&P 500).
According to FactSet the current estimate for Q3 earnings is negative 5.5% for the S&P 500. While there are often some upside surprises, they expect a negative quarter in any event. Q2 was also negative, so if Q3 is negative that would be the first time there were 2 year-over-year, back-to-back quarterly declines since Q2 & Q3 of 2009.The current estimate (according to FactSet) for Q4 earnings is negative 0.4% for the S&P 500. If that comes to pass, that would be 3 back-to-back, year-over-year quarterly declines.
This chart is for sequential quarterly earnings, presenting a difficult period for the index. Recent declines plus the expected Q3 and Q4 declines look uncomfortably like prior periods that saw accompanying index price declines. Analysts are predicting earnings growth in 2016, however.
(click image to enlarge)
With respect to Europe, Thomson Reuters reports that the STOXX 600 is expected to have an earnings decline of 4.1% for Q3 on an 8.3% revenue decline
Before you run off to buy EPP for the 5.57% yield, look behind it to the holdings.
Australia (commodity export based economy) is about 57% of the EPP holdings. Within Australia, the top five holding are 4 banks and 1 mining company totaling about 1/3 of total assets. Those five stocks yield from 5.5% to 6.6%. Those are high numbers that call out for close inspection. The banks may be highly leveraged to commodities, as is the country.
If you like the commodities, you may like Australia, and EPP — otherwise look elsewhere.
If we accept the forward P/E and forward earnings growth estimates published by Morningstar, we can calculate the PEG ratio for each security.
If we accept that PEG ratios under 2x are reasonable, and under 1x are attractive; then China would be attractive (if you have confidence in the estimates); and most of the rest would be reasonably attractive (with Asia Pacific ex Japan and Switzerland being expensive at more than 2x PEG).
This table presents the current technical view of the same securities. The ratings are from StockCharts (John Murphy), BarChart, Market-Edge, and from our own 4-factor technical rating.
None of the securities is strongly attractive technically at this time, and none are moderately attractive by consensus of the four ratings sources.
Note: a description of each rating approach is located at the bottom of this article as a post-script.
The following monthly charts are for the QVM rating method.
The main panel provides the individual indicator data, and the upper panel provides a black line summarizing the 4 factors on a 0-100 scale (in units of 25), where zero is all indicators negative and 100 is all indicators positive.
The two primary factors (necessary but not sufficient) are the position of the price above or below the 12 month moving average; and the direction of the tip of the 12 month moving average.
The two secondary factors (used for confirmation of the primary factors) are the 12-month money flow index (introduces volume — in green), and the parabolic stop and reverse indicator (introduces time and pace — in blue dots).
United States
Eurozone
Japan
Emerging Markets
United Kingdom
Asia Pacific ex Japan
Switzerland
China
The S&P 500 is mentioned in this article alongside the abovementioned ETS. Good ETF proxies for the S&P 500 are: SPDR S&P 500 (N:SPY), iShares Core S&P 500 (N:IVV), Vanguard S&P 500 (N:VOO) and the VFINX mutual fund.
————
POST-SCRIPT: TECHNICAL RATINGS DESCRIPTIONS
StockChart Technical Rating Criteria ……
Long-Term Indicators (weighting)
Medium-Term Indicators (weighting)
Short-Term Indicators (weighting)
BarChart Technical Indicators ……
Short Term Indicators (7 to 50 day indicators)
Medium Term Indicators (20+ to 50 day indicators)
Long Term Indicators (50+ to 100 day indicators)
MarketEdge Second Opinion Indicators ……
Market-EdgeScore
Score is a value between -4 and +4 and indicates whether the technical condition of the stock is improving or deteriorating. A score of -4 represents the worst extreme possible before the stock is Downgraded to Avoid while a score of +4 indicates the best level obtainable before the stock is Upgraded to a Long Opinion. It is suggested that you take defensive action if you are long a stock and the Score deteriorates to -3 or -4. Conversely, if you short a stock take defensive action if the Score is +3 or +4.
QVM 4 Factor Technical Rating ……
We look at monthly data to see:
The first two factors are necessary, but not sufficient, to trigger a major reversal alert – because alone they are prone to whipsaw.
The third and fourth factors measure different things than the first and second, and are necessary to confirm the alerts from the first and second to minimize whipsaw risk.
Trading in financial instruments and/or cryptocurrencies involves high risks including the risk of losing some, or all, of your investment amount, and may not be suitable for all investors. Prices of cryptocurrencies are extremely volatile and may be affected by external factors such as financial, regulatory or political events. Trading on margin increases the financial risks.
Before deciding to trade in financial instrument or cryptocurrencies you should be fully informed of the risks and costs associated with trading the financial markets, carefully consider your investment objectives, level of experience, and risk appetite, and seek professional advice where needed.
Fusion Media would like to remind you that the data contained in this website is not necessarily real-time nor accurate. The data and prices on the website are not necessarily provided by any market or exchange, but may be provided by market makers, and so prices may not be accurate and may differ from the actual price at any given market, meaning prices are indicative and not appropriate for trading purposes. Fusion Media and any provider of the data contained in this website will not accept liability for any loss or damage as a result of your trading, or your reliance on the information contained within this website.
It is prohibited to use, store, reproduce, display, modify, transmit or distribute the data contained in this website without the explicit prior written permission of Fusion Media and/or the data provider. All intellectual property rights are reserved by the providers and/or the exchange providing the data contained in this website.
Fusion Media may be compensated by the advertisers that appear on the website, based on your interaction with the advertisements or advertisers.