FTSE Exhibiting Continued Weakness After Sharp Decline
FX Solutions | Mar 25, 2014 12:39AM ET
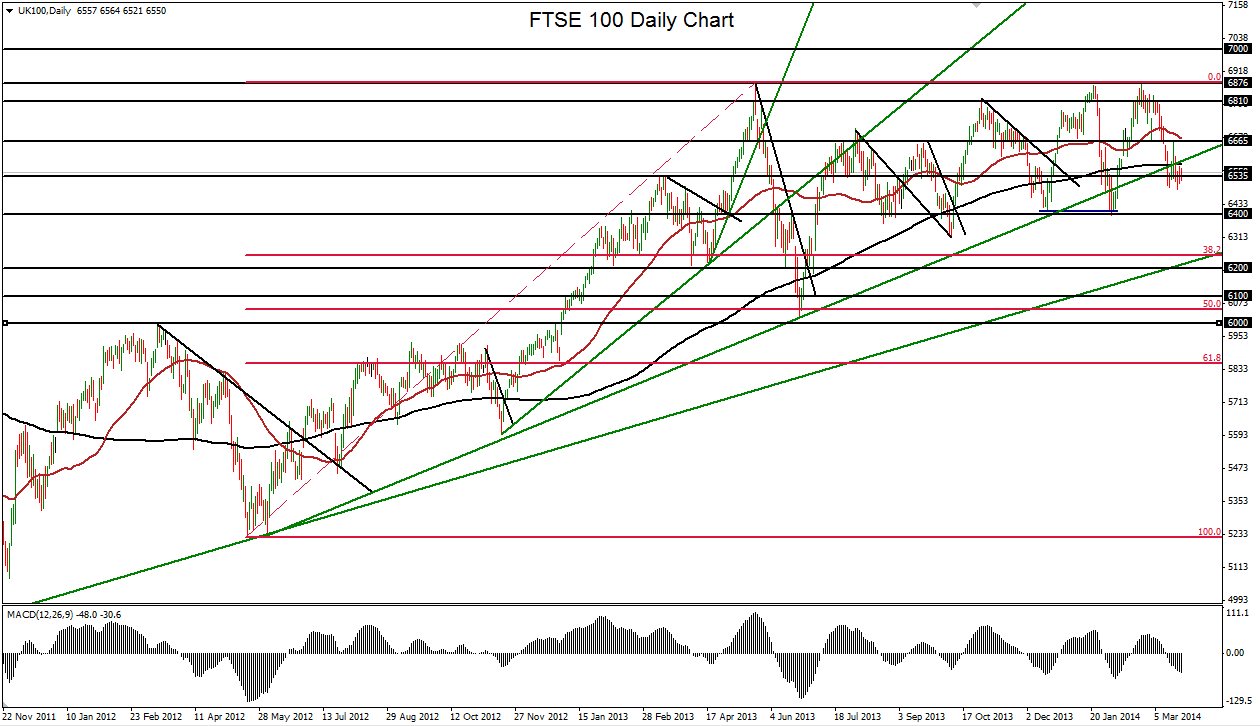
The FTSE 100 (daily chart) has continued to show substantial weakness after making a marked decline from its multi-year peak of 6882 that was established in late February. That high just slightly surpassed the strong resistance imposed by two other relatively recent highs – 6876 in May 2013 and 6867 in January – before plummeting within the past month. Having just reached a six-week low of 6490 late last week, the UK equity index has declined by about 5.7% since its noted 6882 peak in late February.
In the process of this sharp decline, the FTSE has pierced below both its 50-day and 200-day moving averages, and has also dropped below a key uptrend line that extends back to mid-2012. A similar dip below this trend line last occurred in late January before a sharp rebound. Any further weakness in the index should find a major support target around the key 6400 level. Any trading below that level could potentially place the index within significant correction territory. Key upside resistance currently resides around the 6650-6670 price area.
Disclosure: FX Solutions assumes no responsibility for errors, inaccuracies or omissions in these materials. FX Solutions does not warrant the accuracy or completeness of the information, text, graphics, links or other items contained within these materials. FX Solutions shall not be liable for any special, indirect, incidental, or consequential damages, including without limitation losses, lost revenues, or lost profits that may result from these materials.
The products offered by FX Solutions are leveraged products which carry a high level of risk to your capital with the possibility of losing more than your initial investment and may not be suitable for all investors. Ensure you fully understand the risks involved and seek independent advice if necessary.

Trading in financial instruments and/or cryptocurrencies involves high risks including the risk of losing some, or all, of your investment amount, and may not be suitable for all investors. Prices of cryptocurrencies are extremely volatile and may be affected by external factors such as financial, regulatory or political events. Trading on margin increases the financial risks.
Before deciding to trade in financial instrument or cryptocurrencies you should be fully informed of the risks and costs associated with trading the financial markets, carefully consider your investment objectives, level of experience, and risk appetite, and seek professional advice where needed.
Fusion Media would like to remind you that the data contained in this website is not necessarily real-time nor accurate. The data and prices on the website are not necessarily provided by any market or exchange, but may be provided by market makers, and so prices may not be accurate and may differ from the actual price at any given market, meaning prices are indicative and not appropriate for trading purposes. Fusion Media and any provider of the data contained in this website will not accept liability for any loss or damage as a result of your trading, or your reliance on the information contained within this website.
It is prohibited to use, store, reproduce, display, modify, transmit or distribute the data contained in this website without the explicit prior written permission of Fusion Media and/or the data provider. All intellectual property rights are reserved by the providers and/or the exchange providing the data contained in this website.
Fusion Media may be compensated by the advertisers that appear on the website, based on your interaction with the advertisements or advertisers.