FTSE 100 March Holds a 100-Tick Range; S&P 500 Longs Need Stops Below 4025
Jason Sen | Jan 30, 2023 11:37PM ET
Dax 40 March is forming a sideways consolidation as volatility decreases, which is normal in both a bull and bear trend. We do not know how long this process will take, but there is no sell signal.
We held a range of about 250 ticks last week, so there are few decent trading opportunities until we see some movement again.
FTSE 100 March held a 100 tick range last week, so the same levels apply today as we wait for a move.
Remember, when support is broken, it usually acts as resistance and vice-versa.
Today's Analysis
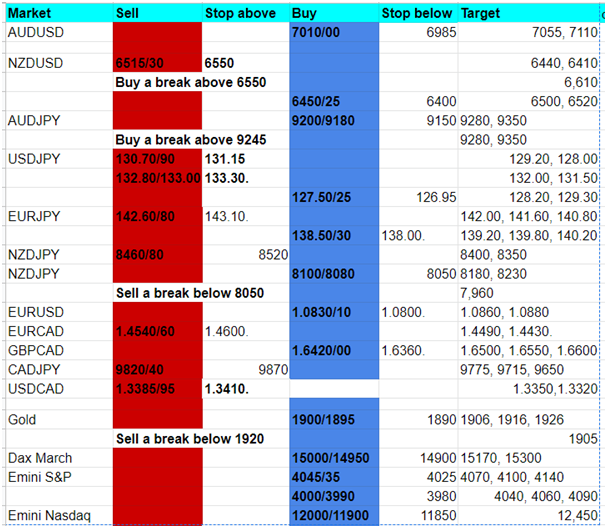
Dax March held a 115-tick range on Friday. Support at 15000/14950 (a low for the day, just 33 tocks above yesterday) with a bounce from here to target minor resistance at 15170/200. If we continue higher, look for strong resistance at the January high of 15300/330. Shorts need stops above 15380. A break higher is a buy signal.
First, support again at 15000/14950. A break lower targets 14870/850, then strong support at 14770/720.
FTSE March longs at first support at 7695/75 worked perfectly yesterday as we established a sideways trend for an easy 50-tick profit on the bounce to strong resistance at 7745/65. (A high for the day here yesterday, in fact) - Shorts need stops above 7785. A break higher is a buy signal targeting 7825 before a retest of 7850/60.
First, support again at 7695/75. Longs need stops below 7865. Emini S&P March reversed from my next target and 1-month rising trend line resistance at 4095/4100 to hit first support at 4045/35. A low for the day here, but longs need stops below 4025.
Nasdaq 100 Futures March wiped out all of Friday's strong gains as we establish a new sideways range. Emini Dow Jones March is clearly in a sideways pattern for two months.
Today's Analysis
S&P 500 Futures March held 1-month rising trend line resistance at 4095/4100 today after that 100-point jump I expected by the end of the week.
The bearish engulfing candle on the 1-hour chart triggered a move to the first support at 4045/35, exactly as predicted. Longs need stops below 4025. A break lower meets a buying opportunity at 4000/3990. Longs need stops below 3980.
Longs at 4045/35 can target 4075, perhaps as far as resistance at 4100/4110. A break higher can retest the December high at 4140/45.
Nasdaq March bearish engulfing candle on the 1-hour chart triggered a move to the downside exactly as predicted to the first support at 12000/11950, with a low for the day right here. Longs need stops below 11850. A break lower today can target 11730/700.
A bounce from first support at 12000/11950 targets 12300, then 12460/480.
Dow Jones Futures hit my next target of 34180/200 on Friday, then reversed on Monday, breaking support at 33980/930 to hit my next target of 33800/750, with a low for the day exactly here. A break below 33700, however, risks a slide to 33500/450.
We should have strong resistance at 34150/200. Shorts need stops above 34300.
Trading in financial instruments and/or cryptocurrencies involves high risks including the risk of losing some, or all, of your investment amount, and may not be suitable for all investors. Prices of cryptocurrencies are extremely volatile and may be affected by external factors such as financial, regulatory or political events. Trading on margin increases the financial risks.
Before deciding to trade in financial instrument or cryptocurrencies you should be fully informed of the risks and costs associated with trading the financial markets, carefully consider your investment objectives, level of experience, and risk appetite, and seek professional advice where needed.
Fusion Media would like to remind you that the data contained in this website is not necessarily real-time nor accurate. The data and prices on the website are not necessarily provided by any market or exchange, but may be provided by market makers, and so prices may not be accurate and may differ from the actual price at any given market, meaning prices are indicative and not appropriate for trading purposes. Fusion Media and any provider of the data contained in this website will not accept liability for any loss or damage as a result of your trading, or your reliance on the information contained within this website.
It is prohibited to use, store, reproduce, display, modify, transmit or distribute the data contained in this website without the explicit prior written permission of Fusion Media and/or the data provider. All intellectual property rights are reserved by the providers and/or the exchange providing the data contained in this website.
Fusion Media may be compensated by the advertisers that appear on the website, based on your interaction with the advertisements or advertisers.