S&P 500: Finding Beauty In The Last Three Days
Kay Kim | Jun 30, 2016 05:04PM ET
S&P 500 Monthly-Chart Perspective
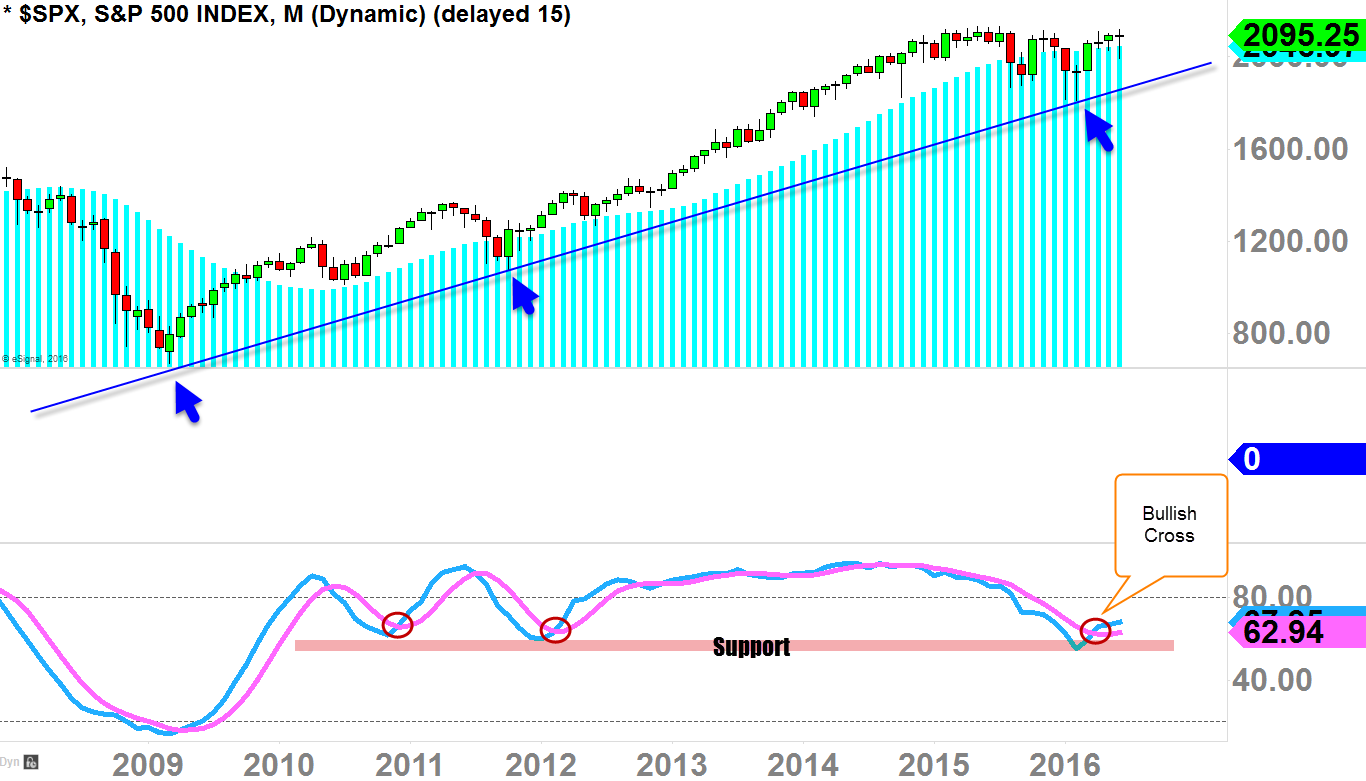
By the closing-bell last Monday, you would find the monthly-chart candle looking pretty bleak with the red-bearish-colored candle ready to dive below the monthly 20-SMA (blue histogram in the chart below).
But the extraordinary thing has happened last three days as it saves the whole month of June's sentiment, as the monthly-candle so quickly transformed by the close today with doji candle trading above the monthly-20SMA as we close the month of June's final day of trading.
Why is it so important?
Because by the closing-bell last Monday, the oscillator (in the chart below) was actually curling back down not able to see any openings between the two lines (signaling abrupt bearish pressure).
Long-term buyers/bulls want to make sure this oscillator continues to see it's opening and widening to the upside for the continuation of the primary-term uptrend as we are still staying on that Oscillator-support (bullish sentiment).
- Bulls emergency search for finding beauty has ended today with positive result ending the month of June with bullish sentiment.
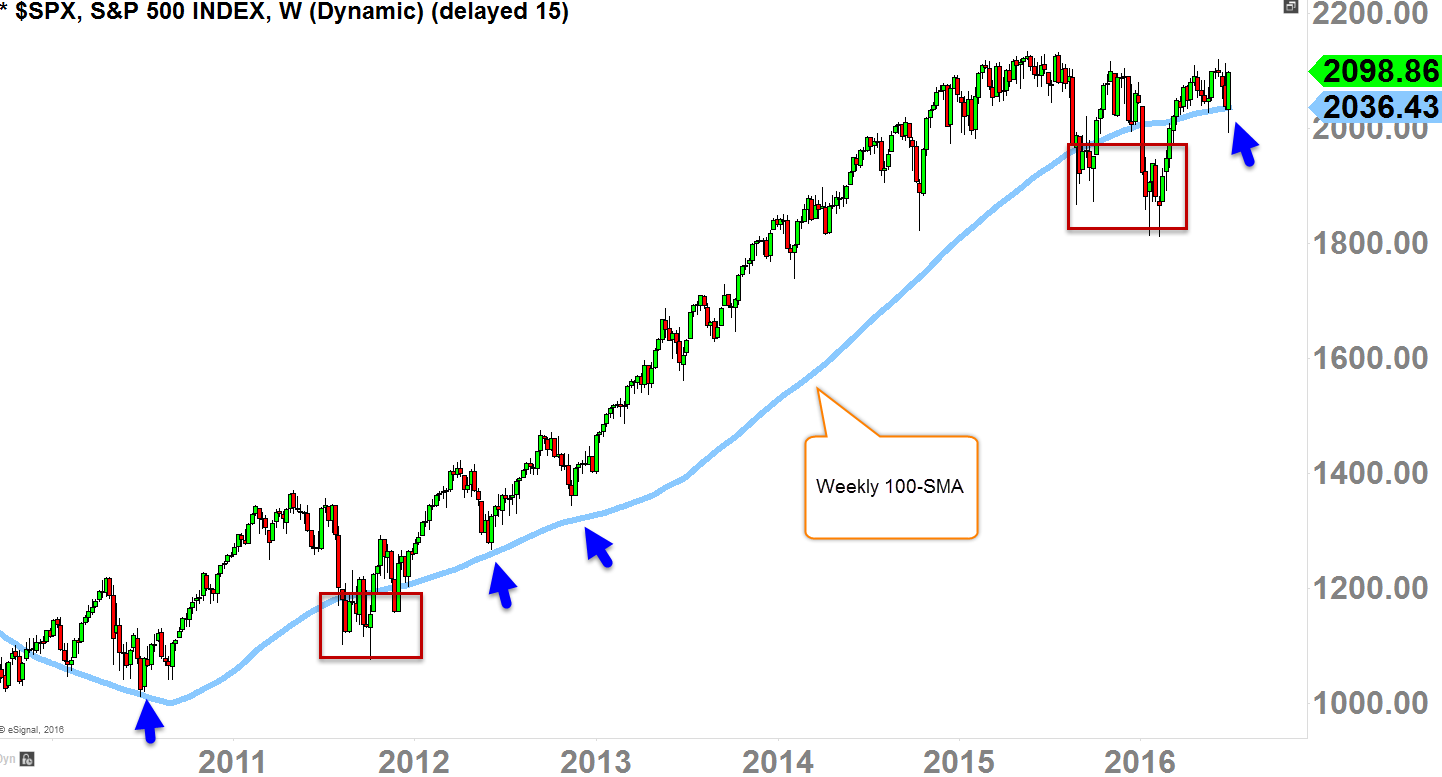
When you diagnose health of the primary-term uptrend, you want to see weekly-chart staying above the 100-SMA (simple moving average), because the sentiment is bullish as long as we stay above this moving average on the weekly-chart.
As you can see in the chart below, we have been below this moving average sending "shocking waves" throughout the market (red boxes); but as it bounces back above this moving average, buyers regain confidence.
Last three days, bulls has found beauty because without the last three days move, the weekly-candle would be red and sitting below this moving average today.
This means the bullish sentiment continues as this was VERY FAST recovery.
Trading in financial instruments and/or cryptocurrencies involves high risks including the risk of losing some, or all, of your investment amount, and may not be suitable for all investors. Prices of cryptocurrencies are extremely volatile and may be affected by external factors such as financial, regulatory or political events. Trading on margin increases the financial risks.
Before deciding to trade in financial instrument or cryptocurrencies you should be fully informed of the risks and costs associated with trading the financial markets, carefully consider your investment objectives, level of experience, and risk appetite, and seek professional advice where needed.
Fusion Media would like to remind you that the data contained in this website is not necessarily real-time nor accurate. The data and prices on the website are not necessarily provided by any market or exchange, but may be provided by market makers, and so prices may not be accurate and may differ from the actual price at any given market, meaning prices are indicative and not appropriate for trading purposes. Fusion Media and any provider of the data contained in this website will not accept liability for any loss or damage as a result of your trading, or your reliance on the information contained within this website.
It is prohibited to use, store, reproduce, display, modify, transmit or distribute the data contained in this website without the explicit prior written permission of Fusion Media and/or the data provider. All intellectual property rights are reserved by the providers and/or the exchange providing the data contained in this website.
Fusion Media may be compensated by the advertisers that appear on the website, based on your interaction with the advertisements or advertisers.