Finding Basing Patterns That Precede The Best Breakouts
Deron Wagner | Jul 02, 2013 02:15AM ET
Stock breakouts are about more than simply buying stocks that are trading at new highs. In order for a breakout to be valid and without a high risk of failure, a stock must first possess a valid base of consolidation on its chart pattern.
In this educational article, we clearly show you how to spot the two best basing patterns on a stock chart: Deep Correction (Cup and Handle) and Shallow Correction (Flat Base).
We suggest studying these chart patterns closely, as it will enable you to develop your eye and eventually read stock charts like a pro.
Deep Correction – “Cup And Handle” Type Pattern
Following are the technical characteristics of a deep correction, along with an actual visual example.
- The pattern must form within an existing uptrend, and stock must be at least 30-40% off the lows. This rule is very important. Do not go looking for cup and handle patterns with stocks trading at or near 52-week lows! The best cup and handle patterns form near 52-week highs. Stocks that are breaking out to new all time highs are ideal because they lack overhead resistance.
- The 50-day moving average should be above the 200-day moving average, and the 200-day moving average should have already been trending higher for at least a few months.
- The base typically forms on a pullback of 20-35% off the highs, and is at least seven weeks in length.
- As the base rounds out and the price returns back above the 50-day moving average and holds, be on the lookout for the “handle” to form. The handle usually forms 5-10% below the highs of the left side of the pattern.
- The handle itself should drift lower, and is typically 5-10% or so in width. Handles that retrace more than 15% are too volatile and prone to failure.
- Handles should be at least 5 days in length and not form below the 50-day moving average.
Putting it all together, this chart of LinkedIn ($LNKD) shows a valid cup and handle type pattern, based on the technical criteria above:
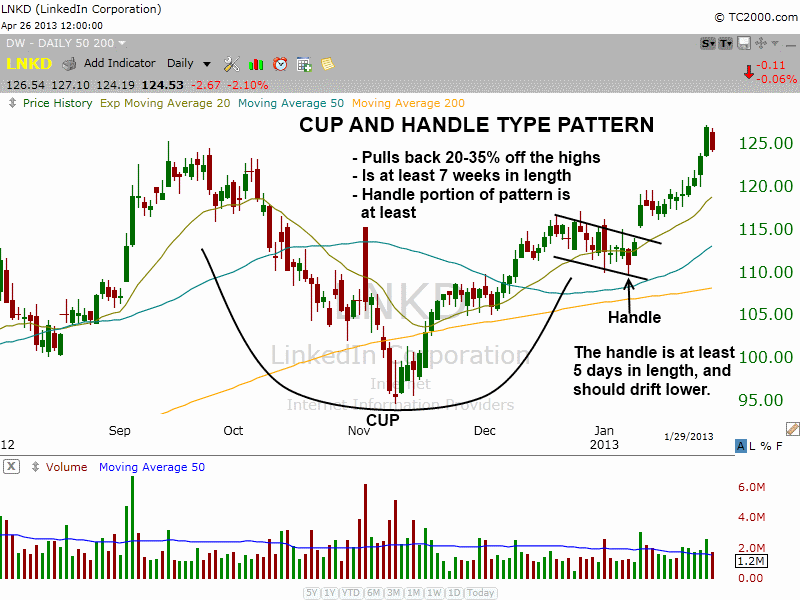
On the chart above, notice the 200-day moving average (orange line) is in a clear uptrend. The 50-day moving average (teal line) is above the 200-day moving average, and the 20-day exponential moving average has crossed above the 50-day moving average.
When the 20-day exponential moving average is above the 50-day moving average, and the price action is above both averages, it is the ideal time for a handle to form.
The key to the handle is that price action should drift lower to shake out the “weak hands.”
The buy point for this type of swing trade setup is a breakout above the high of the handle. However, over the years, we have learned to establish partial position size at or near the lows of a handle, and add to the position on the breakout above the high of the handle. This enables us to lower our average cost and provides a better reward to risk ratio.
Shallow Correction – Flat Base
A shallow correction is also known as a flat base, and the pattern should possess the following characteristics:
- As with the cup and handle type pattern, a flat base must form within an existing uptrend. Typically, it will form after a breakout from a deeper correction (like a cup and handle base).
- The best way to identify a flat base is by using the weekly chart timeframe. The majority of the base should form above the rising 10-week moving average (or 50-day moving average on daily chart).
- The 10-week moving average should be trading well above the 40-week moving average
- A flat base should be at least 5 weeks in length.
- Flat bases usually correct no more than 15% off the highs
The following chart of Pharmacyclics ($PCYC) illustrates what a flat base should look like:
Although the weekly chart above is a great example of a flat base, the pullback was just a bit over 15% at 17%. A flat base should form around 10-15% off the highs, but 16-18% is okay, especially if the stock is volatile. If the pattern is 25% wide, it is probably not a flat base. Please just use common sense with these rules.
Also on the chart of $PCYC, notice the entire base finds support at the rising 10-week moving average, which is a very bullish sign. Further, the 10-week moving average is well above the 40-week moving average, and both indicators are in a clear uptrend.
The buy point of a flat base is on a breakout above the highs of the pattern. As with cup and handle patterns, we usually try to establish partial size before the breakout if possible.
Keep It Tight!
When finding bullish stocks patterns, it is crucial to look for a tightening of the price action on the right hand side of the base.
The left hand side is the initial drop off the highs, where the price action cracks and becomes wide and loose. For the first few weeks, the price action is volatile and there can be quite a bit of selling. But after a few weeks of bottoming action, the stock begins to settle down and push higher.
When the majority of price action is above the 50-day moving average, and the 20-day exponential moving average is above the 50-day moving average, this is when the stock should begin to tighten up.
The following daily chart of Tesaro ($TSRO) clearly shows a tightening of the right hand side of the basing pattern:
On the chart above, the initial decline off the highs (around $20) produced volatile price action for several weeks. However, notice the price action never really broke below the 50-day moving average for more than a few days.
In early January 2013, the price action tightened up. By later in the same month, an extremely tight range develops above the 20-day exponential moving average. This is a classic snapshot of tightening price action, which is something we always look for.
The rules above may be rather precise, but the details are worth studying and memorizing because they have been developed through years and years of experience. Since the most profitable stock picks in our Original post
Trading in financial instruments and/or cryptocurrencies involves high risks including the risk of losing some, or all, of your investment amount, and may not be suitable for all investors. Prices of cryptocurrencies are extremely volatile and may be affected by external factors such as financial, regulatory or political events. Trading on margin increases the financial risks.
Before deciding to trade in financial instrument or cryptocurrencies you should be fully informed of the risks and costs associated with trading the financial markets, carefully consider your investment objectives, level of experience, and risk appetite, and seek professional advice where needed.
Fusion Media would like to remind you that the data contained in this website is not necessarily real-time nor accurate. The data and prices on the website are not necessarily provided by any market or exchange, but may be provided by market makers, and so prices may not be accurate and may differ from the actual price at any given market, meaning prices are indicative and not appropriate for trading purposes. Fusion Media and any provider of the data contained in this website will not accept liability for any loss or damage as a result of your trading, or your reliance on the information contained within this website.
It is prohibited to use, store, reproduce, display, modify, transmit or distribute the data contained in this website without the explicit prior written permission of Fusion Media and/or the data provider. All intellectual property rights are reserved by the providers and/or the exchange providing the data contained in this website.
Fusion Media may be compensated by the advertisers that appear on the website, based on your interaction with the advertisements or advertisers.