Famous Pattern Put Gold Traders Ahead Of The Curve
EWM Interactive | Jul 21, 2019 05:34AM ET
Last week, gold finally broke out of the consolidation it has been locked in for almost a month. The price fell to $1400 before rising to $1453 on Friday, July 19th. But instead of maintaining the positive momentum, the bulls lost steam and allowed the bears to close the weekly session at $1425.66.
Fortunately, a very well-known price pattern was there to not only prepare traders for the initial rally but also to warn them not to trust it too much. The pattern, called a triangle, has a place in both Elliott Wave analysis and conventional technical analysis. It also had a special place on the chart below
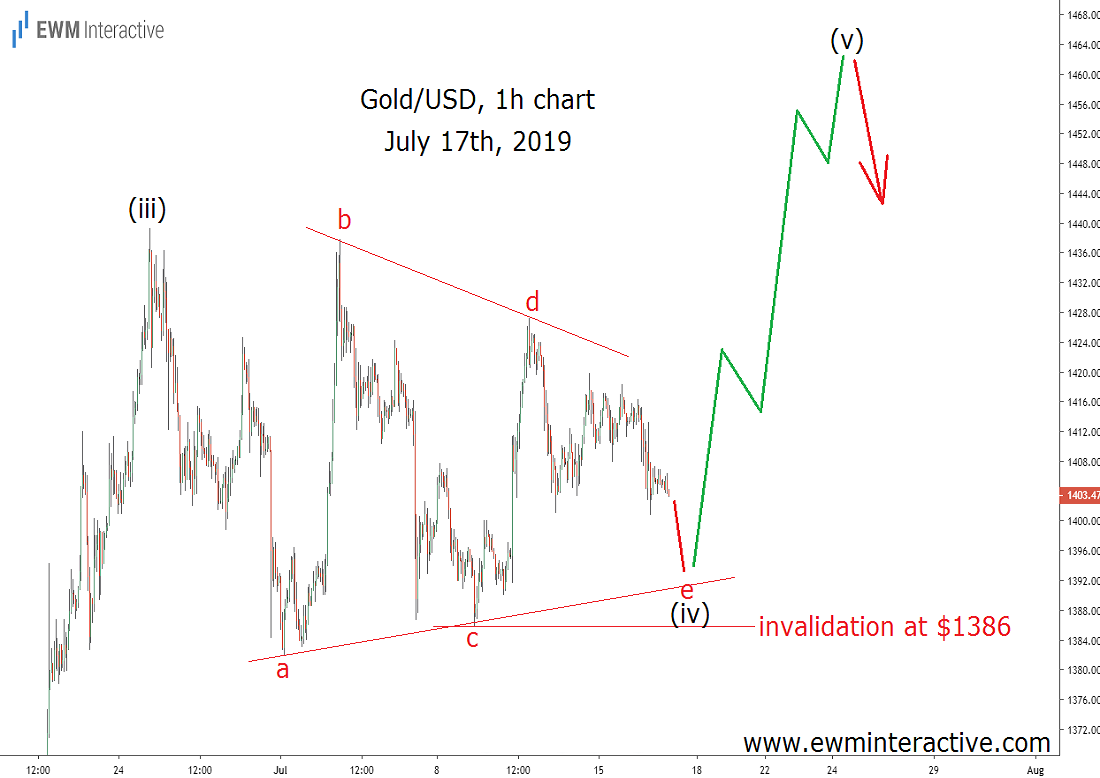
Triangles are sideways corrective patterns, which consist of five sub-waves, labeled a-b-c-d-e. In the contracting variety, each wave is smaller than the previous one. Once a triangle is complete, the larger trend resumes.
In gold ‘s case, the trend prior to the triangle was bullish, so it made sense to expect more strength once the triangle is over. Wave “e” was not supposed to breach the bottom of wave “c”, allowing us to identify $1386 as the invalidation level for this count. The area near $1450 looked like a reasonable target for the bulls in wave (v).
Gold Was Still in an Uptrend, but for How Long?
The other important thing about triangles is that they precede the final wave of the larger sequence. So instead of celebrating the new high in wave (v), traders had to tread carefully and be on alert for a bearish reversal. The updated chart below shows how the situation developed.
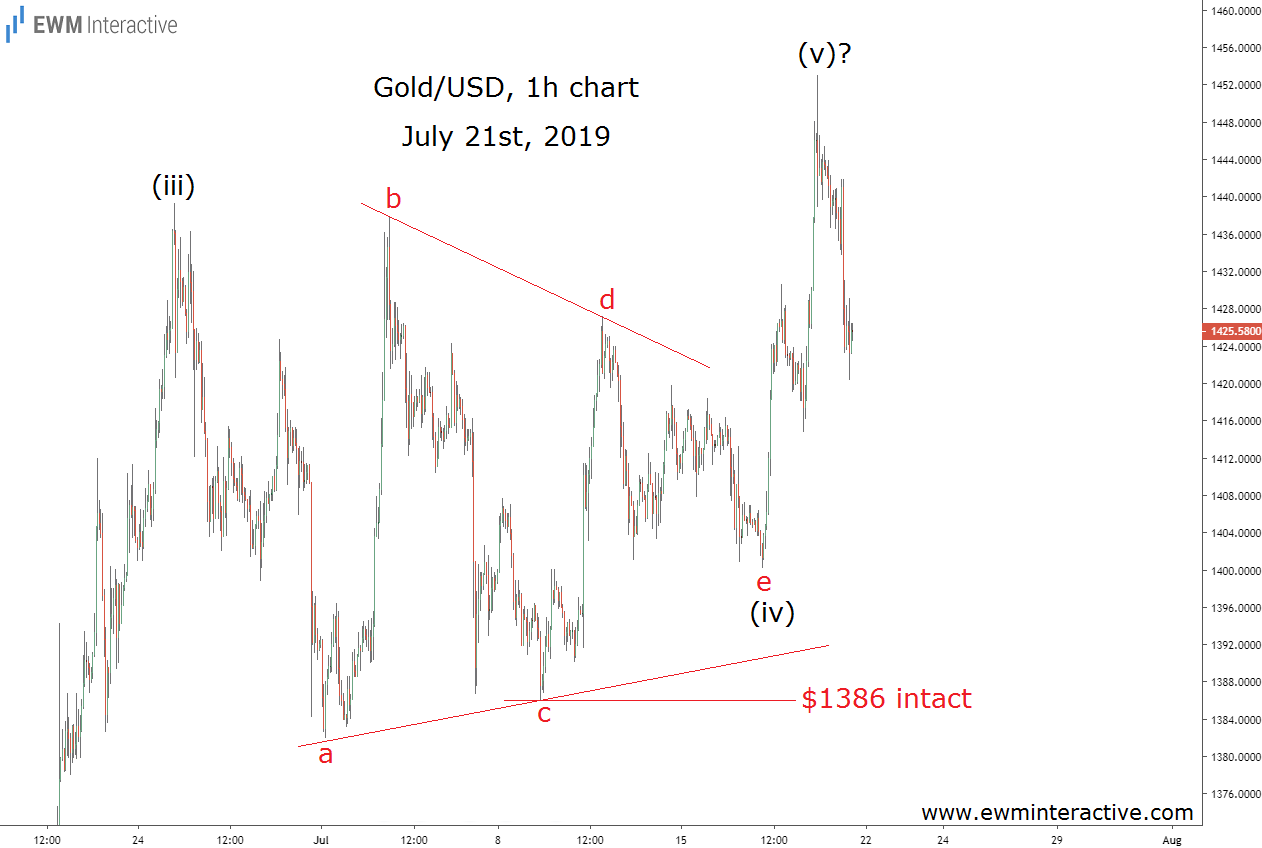
$1386 stayed safe the whole time. The price of gold surged to $1453 before losing almost 2.3% to an intraday low of $1420 on July 19th. And while the exact reversal level was impossible to predict, Elliott Wave traders were still one step ahead of the pack. All thanks to the famous triangle pattern.
Original Post
Trading in financial instruments and/or cryptocurrencies involves high risks including the risk of losing some, or all, of your investment amount, and may not be suitable for all investors. Prices of cryptocurrencies are extremely volatile and may be affected by external factors such as financial, regulatory or political events. Trading on margin increases the financial risks.
Before deciding to trade in financial instrument or cryptocurrencies you should be fully informed of the risks and costs associated with trading the financial markets, carefully consider your investment objectives, level of experience, and risk appetite, and seek professional advice where needed.
Fusion Media would like to remind you that the data contained in this website is not necessarily real-time nor accurate. The data and prices on the website are not necessarily provided by any market or exchange, but may be provided by market makers, and so prices may not be accurate and may differ from the actual price at any given market, meaning prices are indicative and not appropriate for trading purposes. Fusion Media and any provider of the data contained in this website will not accept liability for any loss or damage as a result of your trading, or your reliance on the information contained within this website.
It is prohibited to use, store, reproduce, display, modify, transmit or distribute the data contained in this website without the explicit prior written permission of Fusion Media and/or the data provider. All intellectual property rights are reserved by the providers and/or the exchange providing the data contained in this website.
Fusion Media may be compensated by the advertisers that appear on the website, based on your interaction with the advertisements or advertisers.