False breakout on the Oil is a fact
Alpari Research & Analysis | Jul 24, 2017 05:59AM ET
It is hard to be bullish on Oil and believe in all those cuts and OPEC agreements if some countries actually increase the production. It is hard to be a buyer there when non-OPEC countries increase the output once they see even the smallest bump in prices. And yet, someone is always optimistic here, unfortunately for them, they are just the capital donors for the traders going short and selling every bit of that instrument.
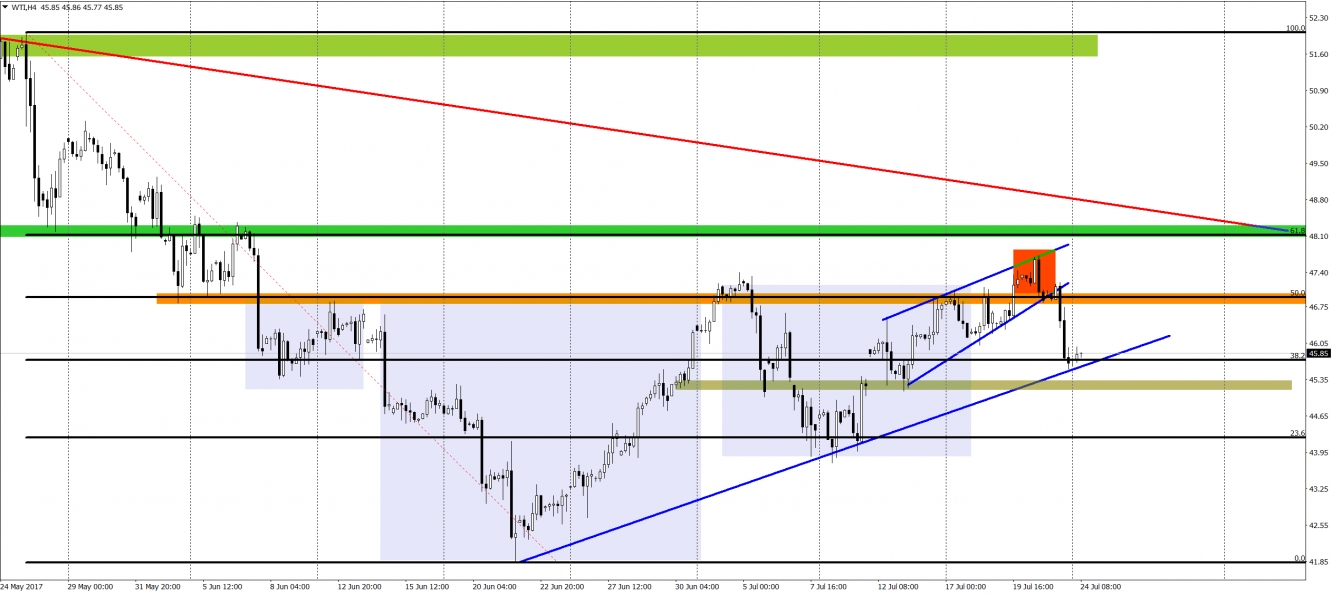
Oil was a bit crazy last week. From the mid-term highs we went to a strong sell signal and a weekly lows. Mid-term highs were reached after we broke a very important resistance, which was a 50% Fibonacci and in the same time a neckline of the large Inverse Head and Shoulder pattern (orange area). Price was climbing and it looked quite nice but then something snapped.
Price dropped sharply creating a false breakout pattern (red rectangle), which is very reliable and indicates a strong reversal. Downswing additionally accelerated when we broke the lower line of short-term channel up formation (blue lines). After that, price had no brakes, all those buyers were caught off guard and their stop loss orders got activated additionally increasing the bearish momentum. You got to love the price action as if you study this method you know that it was created especially to anticipate such movements.
The closest support and the aim is 45,2 USD/oz (dynamic up trendline and a horizontal support). Chances that we will get there are extremely high. That can be just a start. I think that the movement down can be much stronger and the breakout of the lower blue line will release the demons that will keep last buyers awake at nights.

Trading in financial instruments and/or cryptocurrencies involves high risks including the risk of losing some, or all, of your investment amount, and may not be suitable for all investors. Prices of cryptocurrencies are extremely volatile and may be affected by external factors such as financial, regulatory or political events. Trading on margin increases the financial risks.
Before deciding to trade in financial instrument or cryptocurrencies you should be fully informed of the risks and costs associated with trading the financial markets, carefully consider your investment objectives, level of experience, and risk appetite, and seek professional advice where needed.
Fusion Media would like to remind you that the data contained in this website is not necessarily real-time nor accurate. The data and prices on the website are not necessarily provided by any market or exchange, but may be provided by market makers, and so prices may not be accurate and may differ from the actual price at any given market, meaning prices are indicative and not appropriate for trading purposes. Fusion Media and any provider of the data contained in this website will not accept liability for any loss or damage as a result of your trading, or your reliance on the information contained within this website.
It is prohibited to use, store, reproduce, display, modify, transmit or distribute the data contained in this website without the explicit prior written permission of Fusion Media and/or the data provider. All intellectual property rights are reserved by the providers and/or the exchange providing the data contained in this website.
Fusion Media may be compensated by the advertisers that appear on the website, based on your interaction with the advertisements or advertisers.