Ethereum’s $2.35K–$2.75K Range Sets the Stage for Volatility Expansion
MarketPulse | Jul 09, 2025 04:47PM ET
The second largest cryptocurrency has been on a consistent grind in the past two weeks after seeing some heavy selling flows during the Israel-Iran War, taking its prices close to the $2,000 mark but since, has been posting a slow but strong rally, fuel for further continuation.
Crypto markets haven't taken a significant direction for a while, but it doesn't mean that no opportunities are availables – Ranges give the opportunity for markets to cool down and prepare for further moves, while consolidating Volume-at-Price.
Market theory implies that the more prices are at an equilibrium (rangebound), the more solid the anchor of value for all participants.
With cryptos consolidating at much higher levels than prior years, this shows a resilience for cryptocurrency markets and gives it more credibility for traditional investors to start inputting more flows.
For example, since mid-May 2025, Bitcoin has been consolidating between $100,000 to $110,000 – despite giving to many players the opportunity to take their profits, markets did not retrace. Ranges also provide opportunities for scalpers who may attempt to trade highs and lows.
Same for Ethereum which has been holding between $2,350 to $2,750 for close to two months now, and despite these prices being not too close from the Ether's ETH, it still consolidates at a relative high value, particularly after the 2025 Q1 Heavy Selling.
Where Does Ethereum Stand After Close to 2 Months of Consolidation?
Ethereum Daily Chart
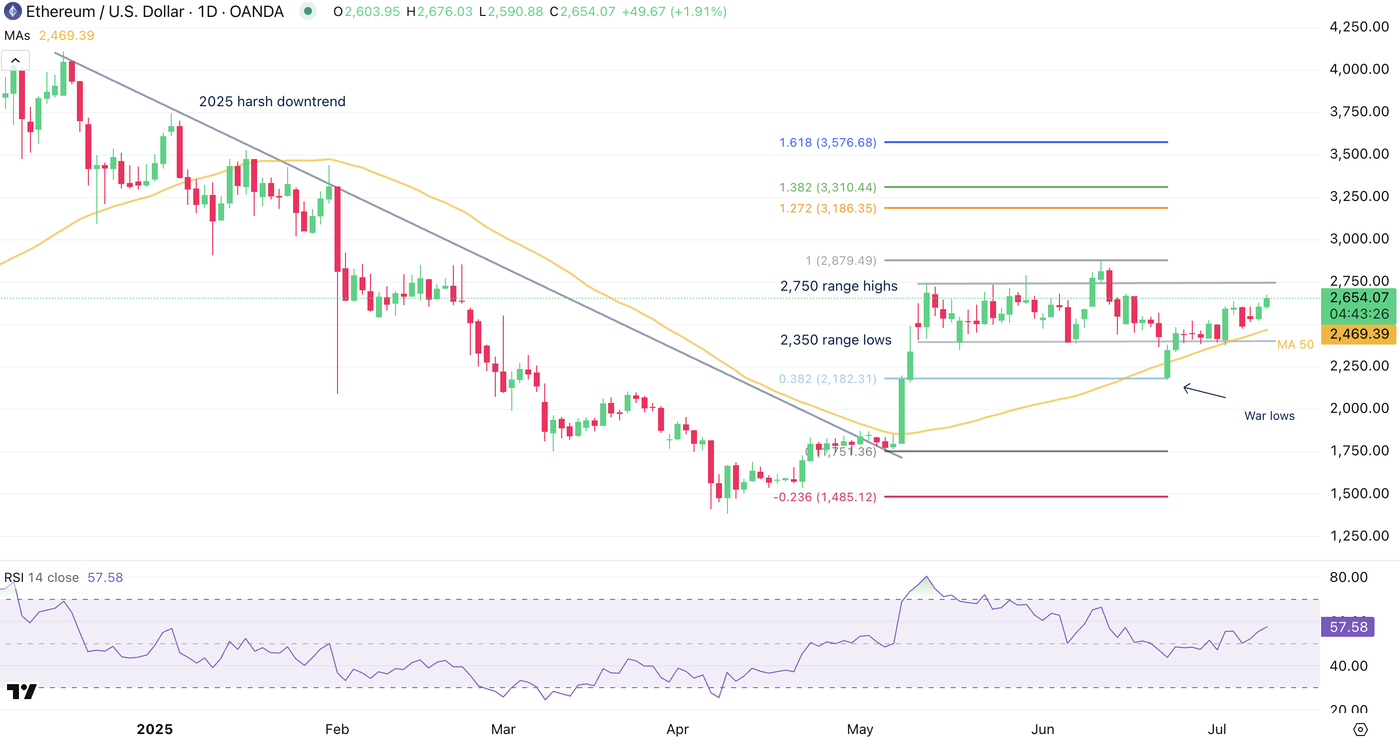
The Daily chart shows decent consolidation with two fakeouts – it can happen that fakeouts lead to players being trapped beyond consolidation levels and create movements on the other side of the range.
An upside fakeout in mid-June led to a retracement down to the $2,174 lows only a few days after.
Since, however, buyers have stepped in consistently using the 50-Day Moving Average as support for continuous buying. with Momentum not moving too fast to the upside (due to the speed and consistency of the buying move), the conditions for an upward breakout are starting to assemble.
A strong buying candle above the 2,750 range highs would be necessary to confirm the hypothesis as a range is poised to hold as long as it holds before the inverse is proven true.
Keep an eye on sentiment in other cryptos, particularly altcoins to spot how crypto players are moving.
Ethereum 4H Chart
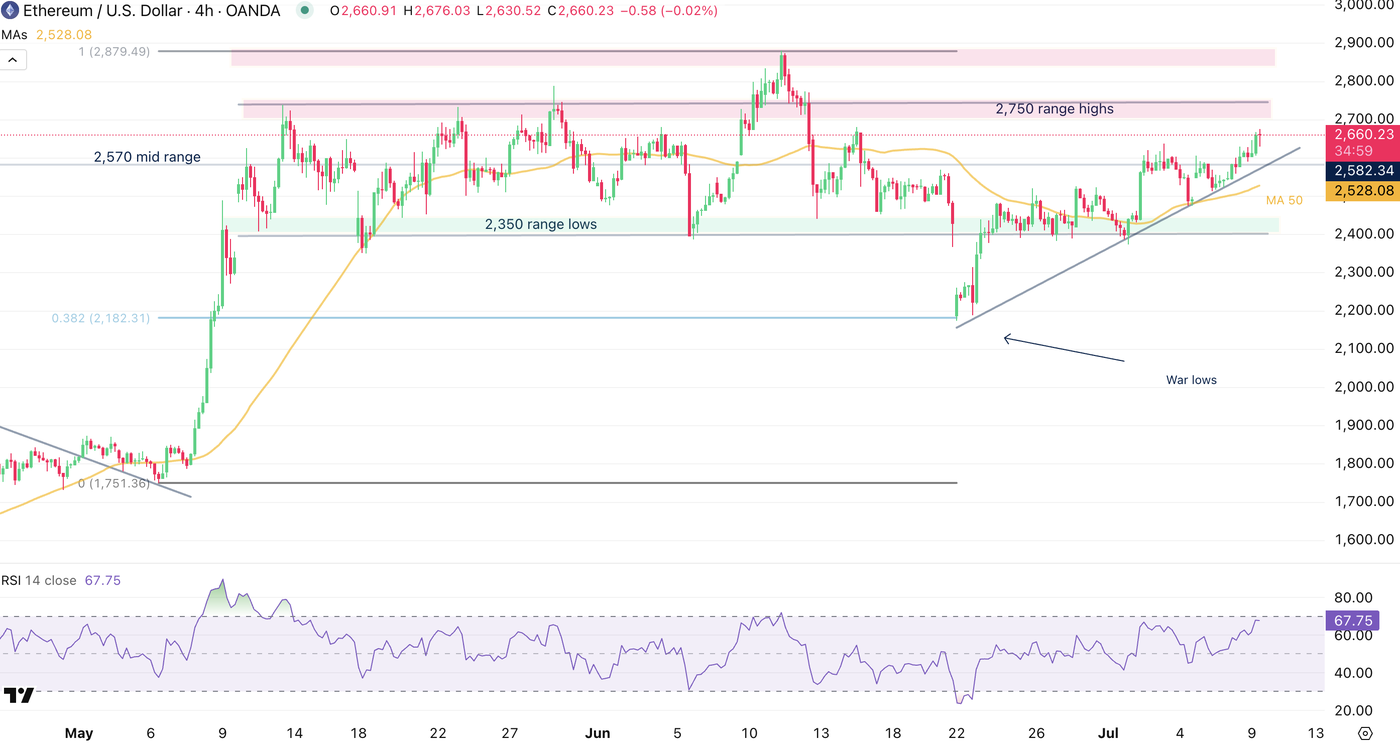
The 4H Candles further give signs of the consistent grind, however it will be essential to spot how buyers react to the increasingly overbought conditions of the shorter timeframe.
The 4H MA 50 is also accompanying the trend with a not-to-steep and stable trendline forming since the war-lows.
Prices will have to hold above the $2,570 mid range level for a breakout to the upside above the $2,750 range highs – June fakeout highs are at $2,880
ETHBTC Check-Up
ETH outperforming Bitcoin is essential for other altcoins to keep growing, as was the case in past cycles, which would provide yet another sign of consistency for the Cryptocurrency markets.
After a downside fakeout, ETHBTC is getting back into its range but still has to overcome the 2.46% mid-range level before showing more bullish signs.
Take a look at our past month ETH analysis to spot why ETH/BTC is such an important ratio to track for cryptocurrency market sentiment analysis.
Safe Trades!
Original Post
Trading in financial instruments and/or cryptocurrencies involves high risks including the risk of losing some, or all, of your investment amount, and may not be suitable for all investors. Prices of cryptocurrencies are extremely volatile and may be affected by external factors such as financial, regulatory or political events. Trading on margin increases the financial risks.
Before deciding to trade in financial instrument or cryptocurrencies you should be fully informed of the risks and costs associated with trading the financial markets, carefully consider your investment objectives, level of experience, and risk appetite, and seek professional advice where needed.
Fusion Media would like to remind you that the data contained in this website is not necessarily real-time nor accurate. The data and prices on the website are not necessarily provided by any market or exchange, but may be provided by market makers, and so prices may not be accurate and may differ from the actual price at any given market, meaning prices are indicative and not appropriate for trading purposes. Fusion Media and any provider of the data contained in this website will not accept liability for any loss or damage as a result of your trading, or your reliance on the information contained within this website.
It is prohibited to use, store, reproduce, display, modify, transmit or distribute the data contained in this website without the explicit prior written permission of Fusion Media and/or the data provider. All intellectual property rights are reserved by the providers and/or the exchange providing the data contained in this website.
Fusion Media may be compensated by the advertisers that appear on the website, based on your interaction with the advertisements or advertisers.